Toronto Condo Stats · Updated November 8, 2026
What Are Condos Selling for in Toronto?
In October 2026, the average condo apartment in the City of Toronto sold for $659,214 and the median for $545,000, according to TRREB.
Condo apartments, City of Toronto, straight from TRREB Market Watch: average and median prices, sales, inventory and days on market, with two full years of history. This is the segment where the market has moved most, and where honest numbers matter most. Buyers: this is your leverage, measured. Owners: this is what you are competing against.
See condos for sale in Toronto
How Are Toronto Condos Selling Right Now?
37% of 2-bed condos sold.
27% of studio condos.
City of Toronto, November 2025 to October 2026. Source: TRREB MLS® data.
How Are Toronto Condos Selling by Bedrooms?
Share of new listings that sold (the sell rate), City of Toronto, November 2025 to October 2026. Seller’s market, 60% and up Balanced, 40 to 59% Buyer’s market, under 40%
A new listing can be the same home listed more than once, so the share of homes that sold is higher. Source: TRREB MLS® data. See every neighbourhood on the map.
Condo Sale Prices: 34 Months
The average Toronto condo sold for $659,214 in October 2026, -5.6% versus a year earlier. The median, the more honest number for a typical unit, was $545,000.
Budget map
Where can I buy in Toronto?
Your budget
Bedrooms
Parking
reaches 18 of 35 districts for a condo apartment.
See the districts and prices →Average sold prices by TRREB district, November 2025 to October 2026.
Looking to Buy a Condo in Toronto?
Tell us what you’re looking for and Michael will send you condos that fit, with the recent sales behind the prices.
Thinking of Selling? See What Your Condo Is Worth
Four questions and you get an instant estimate range from the latest TRREB stats in your district. If you want the real number, Michael will send a free street-level valuation.
Please answer all four questions.
District-level model, not an appraisal. The number that matters comes from comparables on your block.
Get the Real Number, Free
A full comparative market analysis from the Michael Ouzas team: recent sales on and around your street and a pricing strategy, whether you sell this year or in five.
Free Toronto tools from the Michael Ouzas Real Estate Team
Supply vs Demand: Active Listings and Monthly Sales
This is the chart that explains condo prices. When the gap between listings and sales widens, buyers gain leverage; when it narrows, pricing power comes back to sellers.
Last 12 Months
| Month | Average Price | Median Price | Sales | Active Listings | DOM | Share Sold |
|---|---|---|---|---|---|---|
| October 2026 | $659,214 | $545,000 | 949 | 5,251 | 36 | Buyer’s 35% |
| September 2026 | $640,248 | $535,000 | 884 | 5,329 | 40 | Buyer’s 29% |
| August 2026 | $651,648 | $550,000 | 885 | 4,938 | 39 | Buyer’s 38% |
| July 2026 | $672,807 | $561,500 | 1,054 | 5,228 | 37 | Buyer’s 39% |
| June 2026 | $665,760 | $555,500 | 1,124 | 5,464 | 37 | Buyer’s 39% |
| May 2026 | $673,841 | $565,000 | 1,009 | 5,490 | 33 | Buyer’s 33% |
| April 2026 | $665,507 | $560,000 | 1,054 | 5,315 | 37 | Buyer’s 35% |
| March 2026 | $648,287 | $570,000 | 951 | 4,912 | 37 | Buyer’s 33% |
| February 2026 | $663,984 | $575,000 | 733 | 4,529 | 43 | Buyer’s 33% |
| January 2026 | $631,932 | $562,500 | 568 | 4,296 | 50 | Buyer’s 24% |
| December 2025 | $663,227 | $546,500 | 694 | 3,927 | 44 | Balanced 58% |
| November 2025 | $701,259 | $580,000 | 880 | 5,339 | 41 | Balanced 40% |
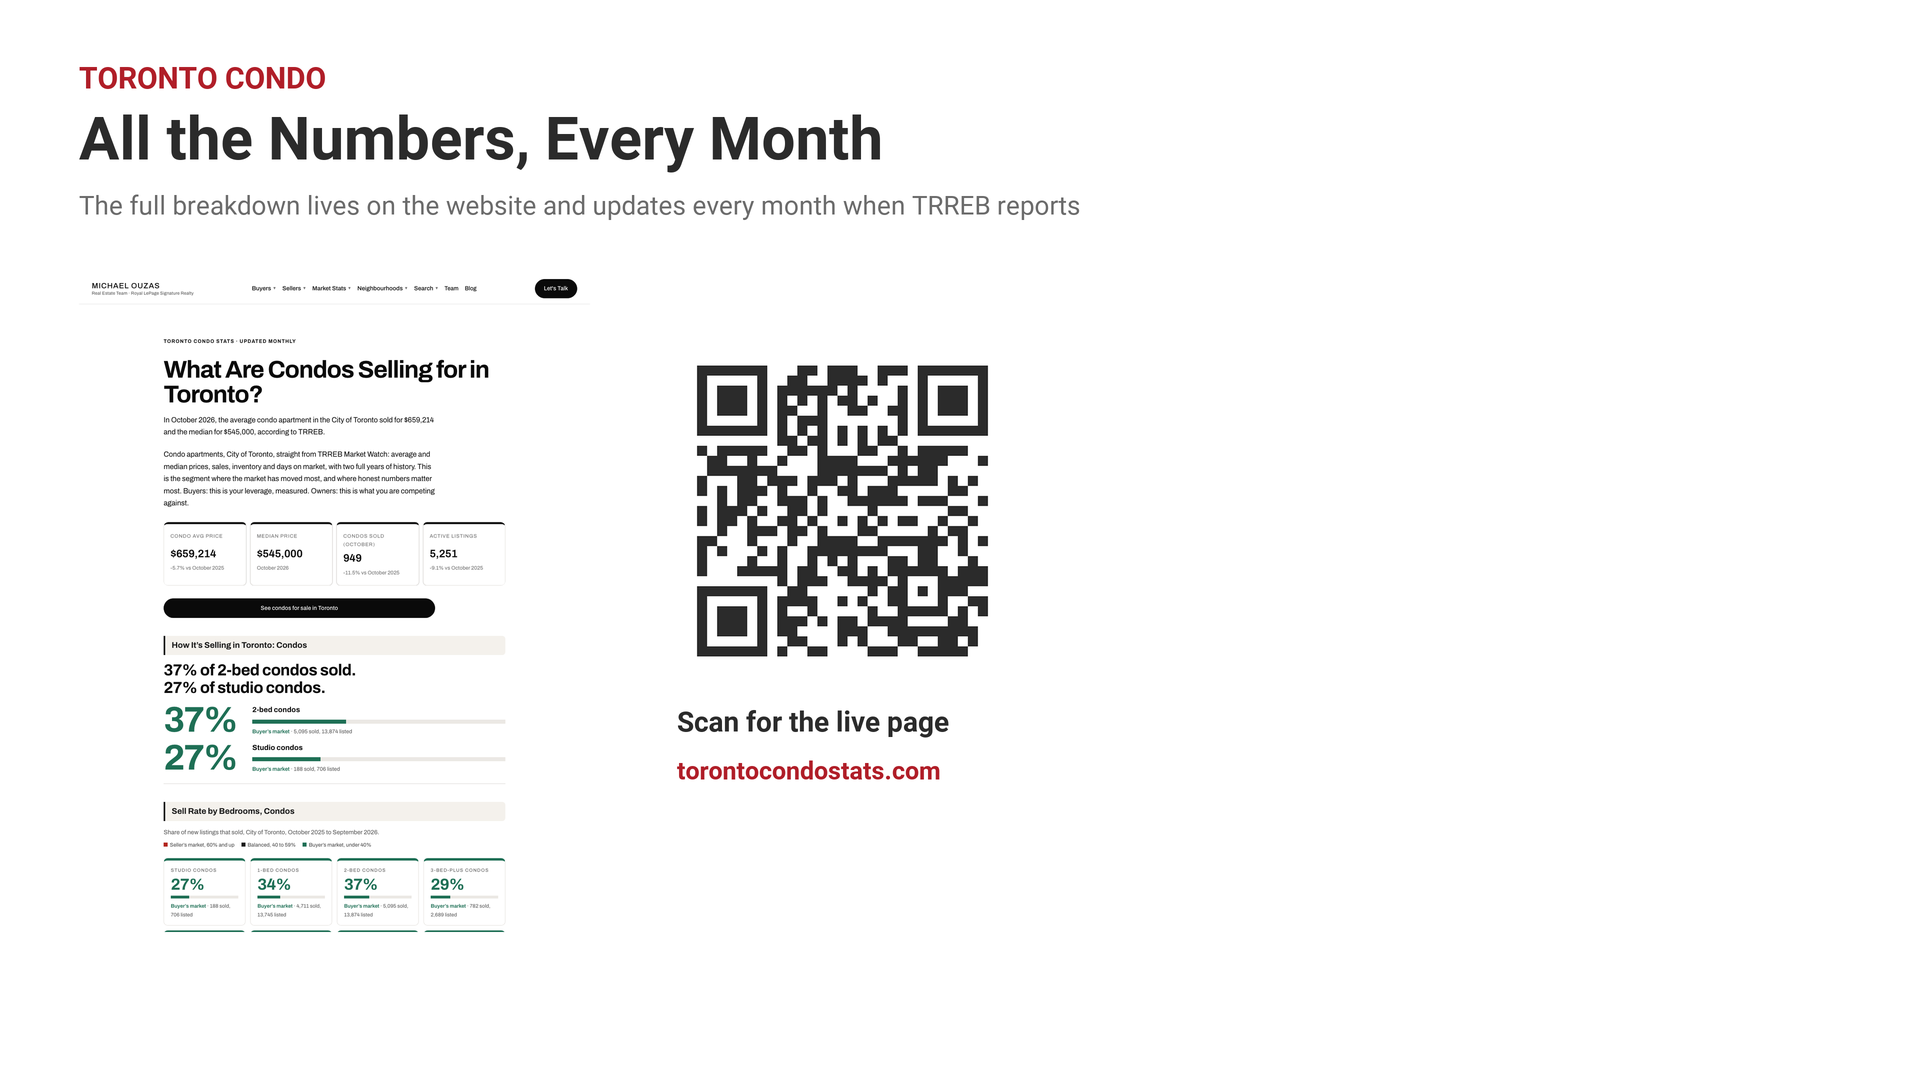
October 2026 in Slides
The slide deck from this month’s Toronto condo market update. Scroll through the deck, or watch the full breakdown.
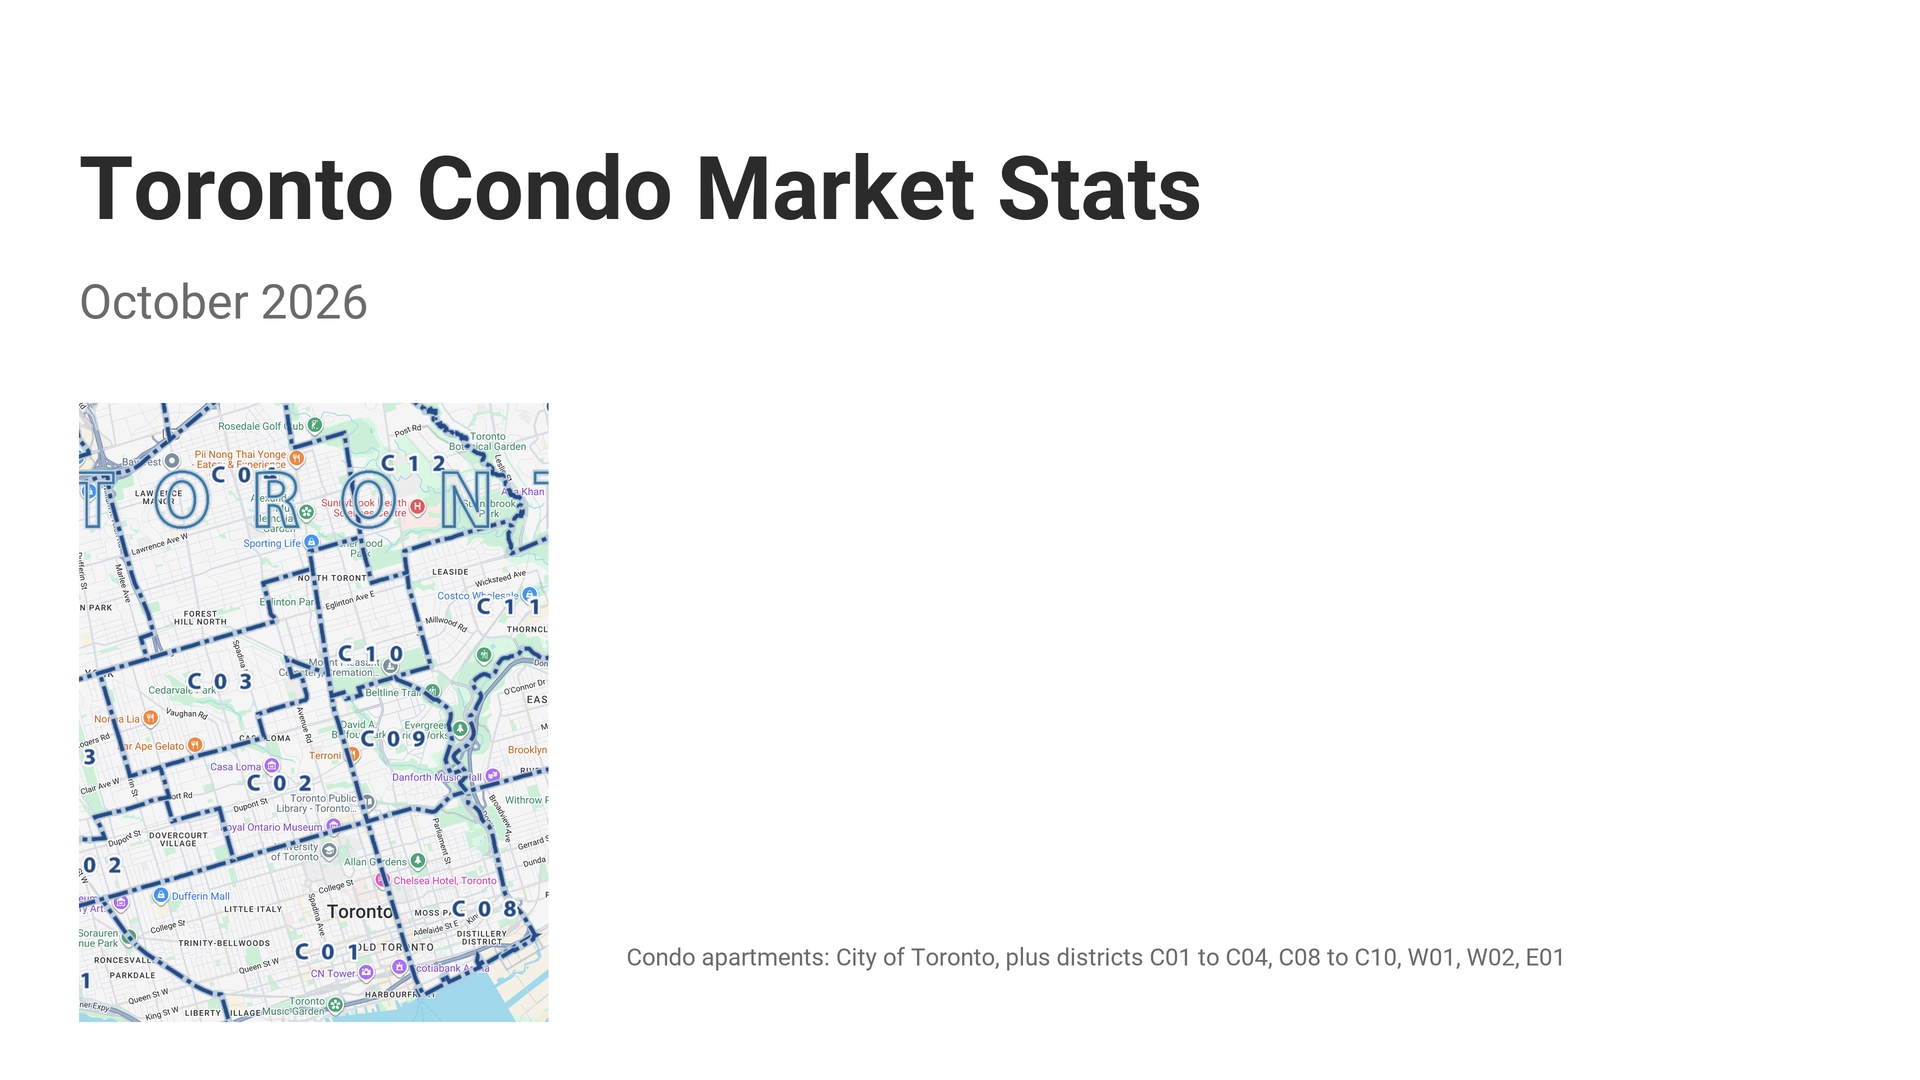
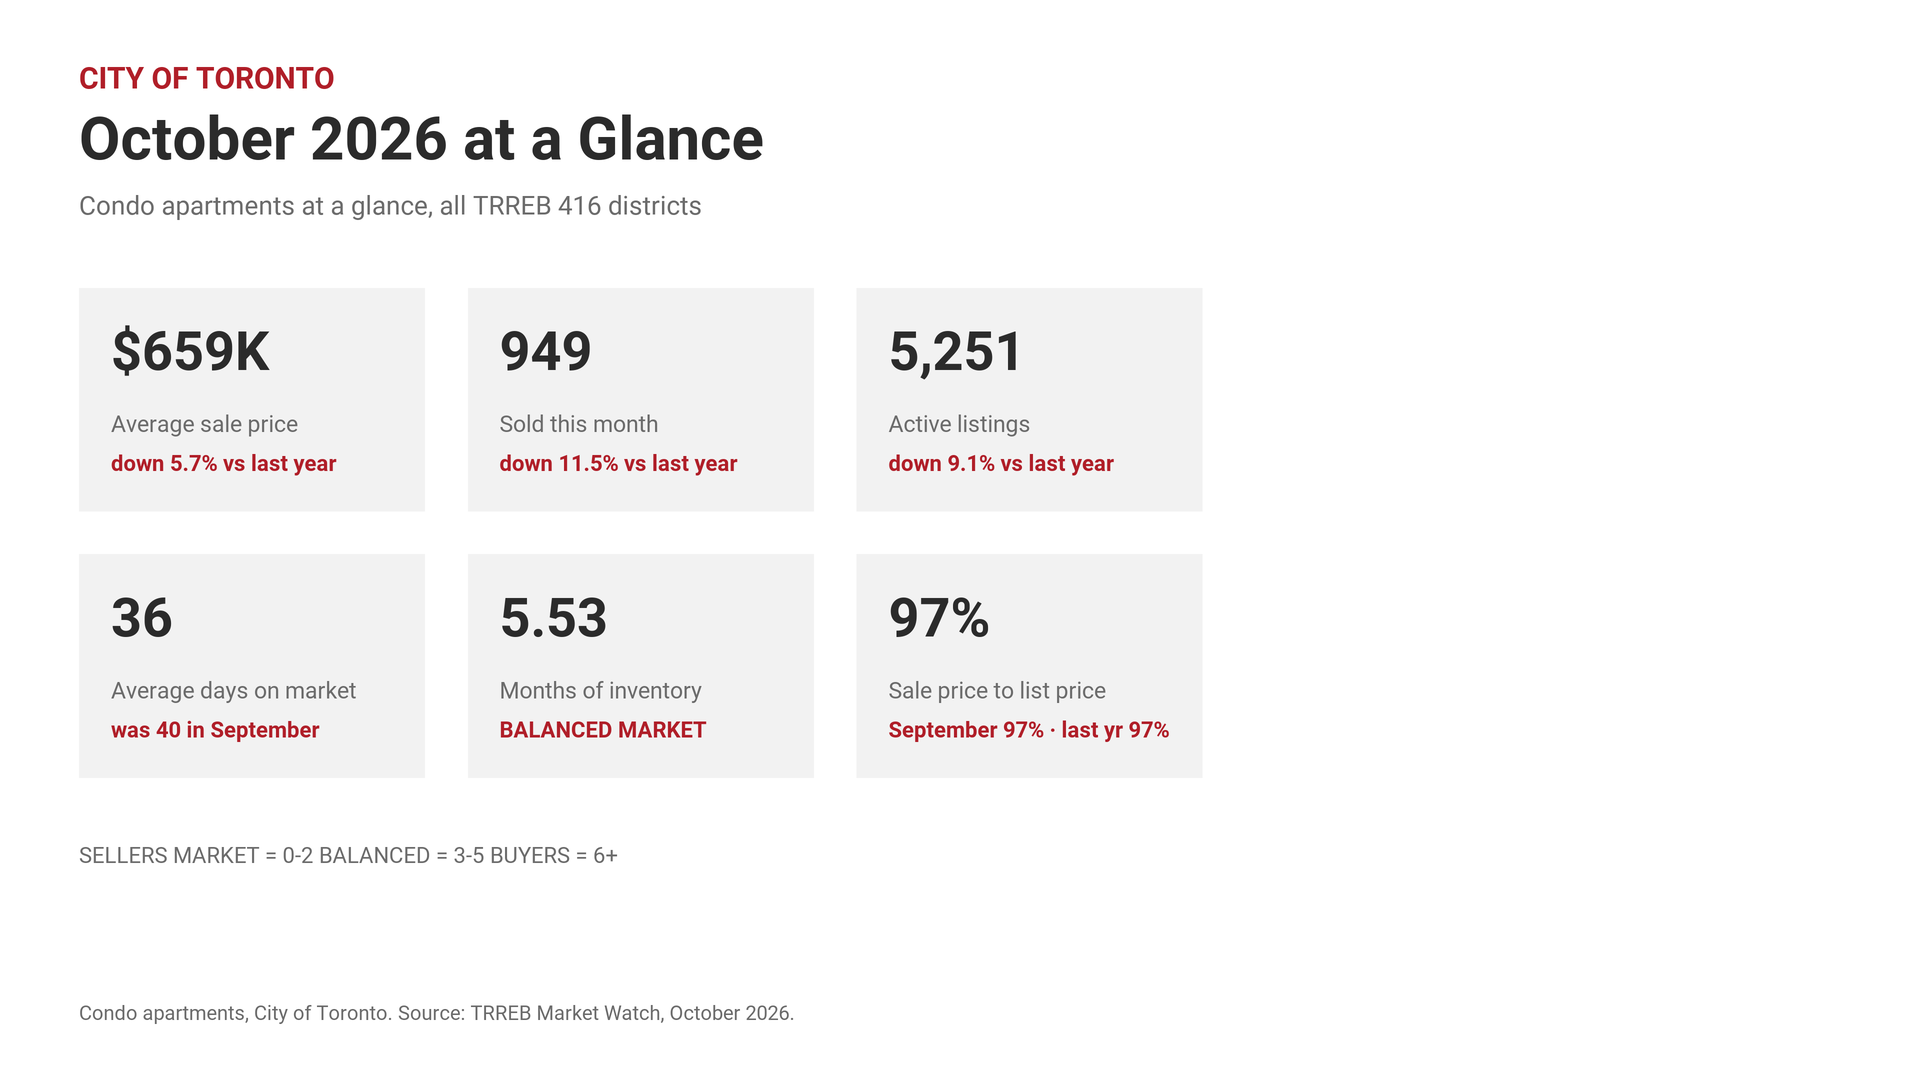
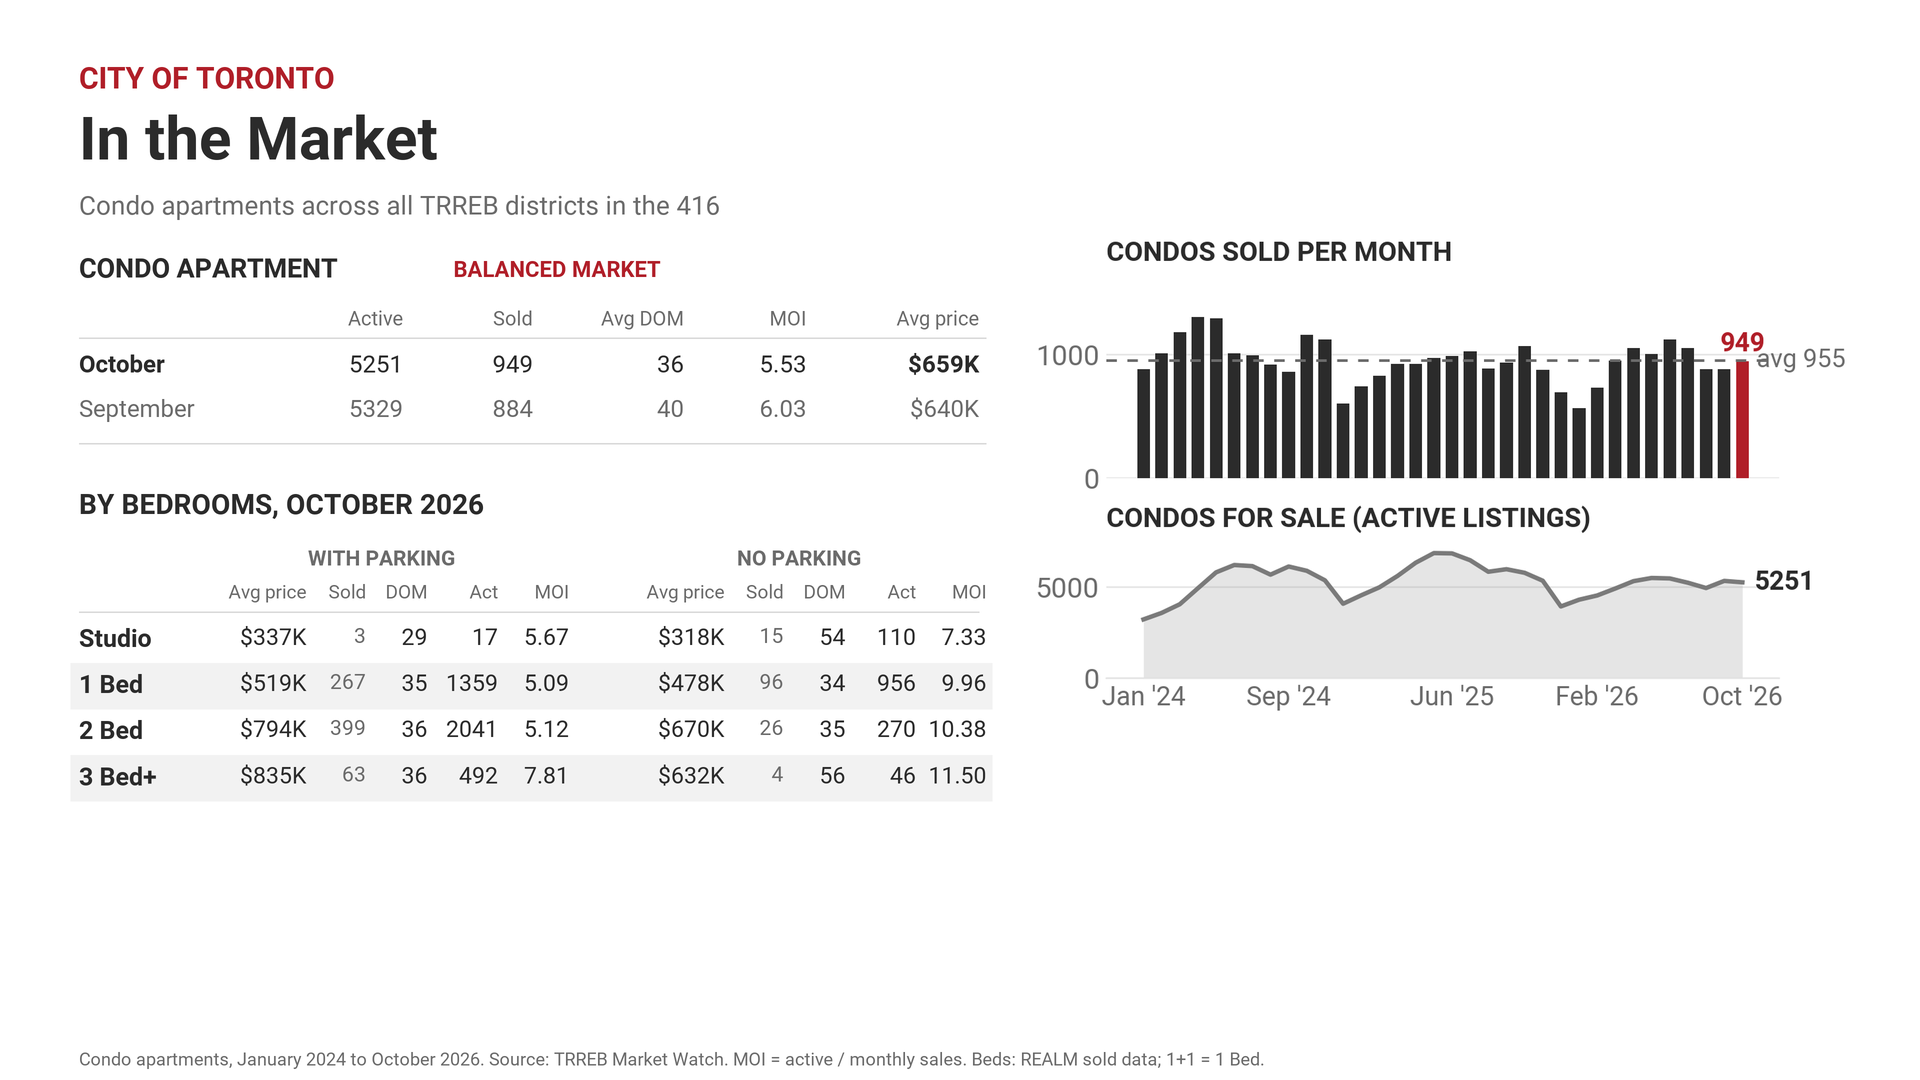
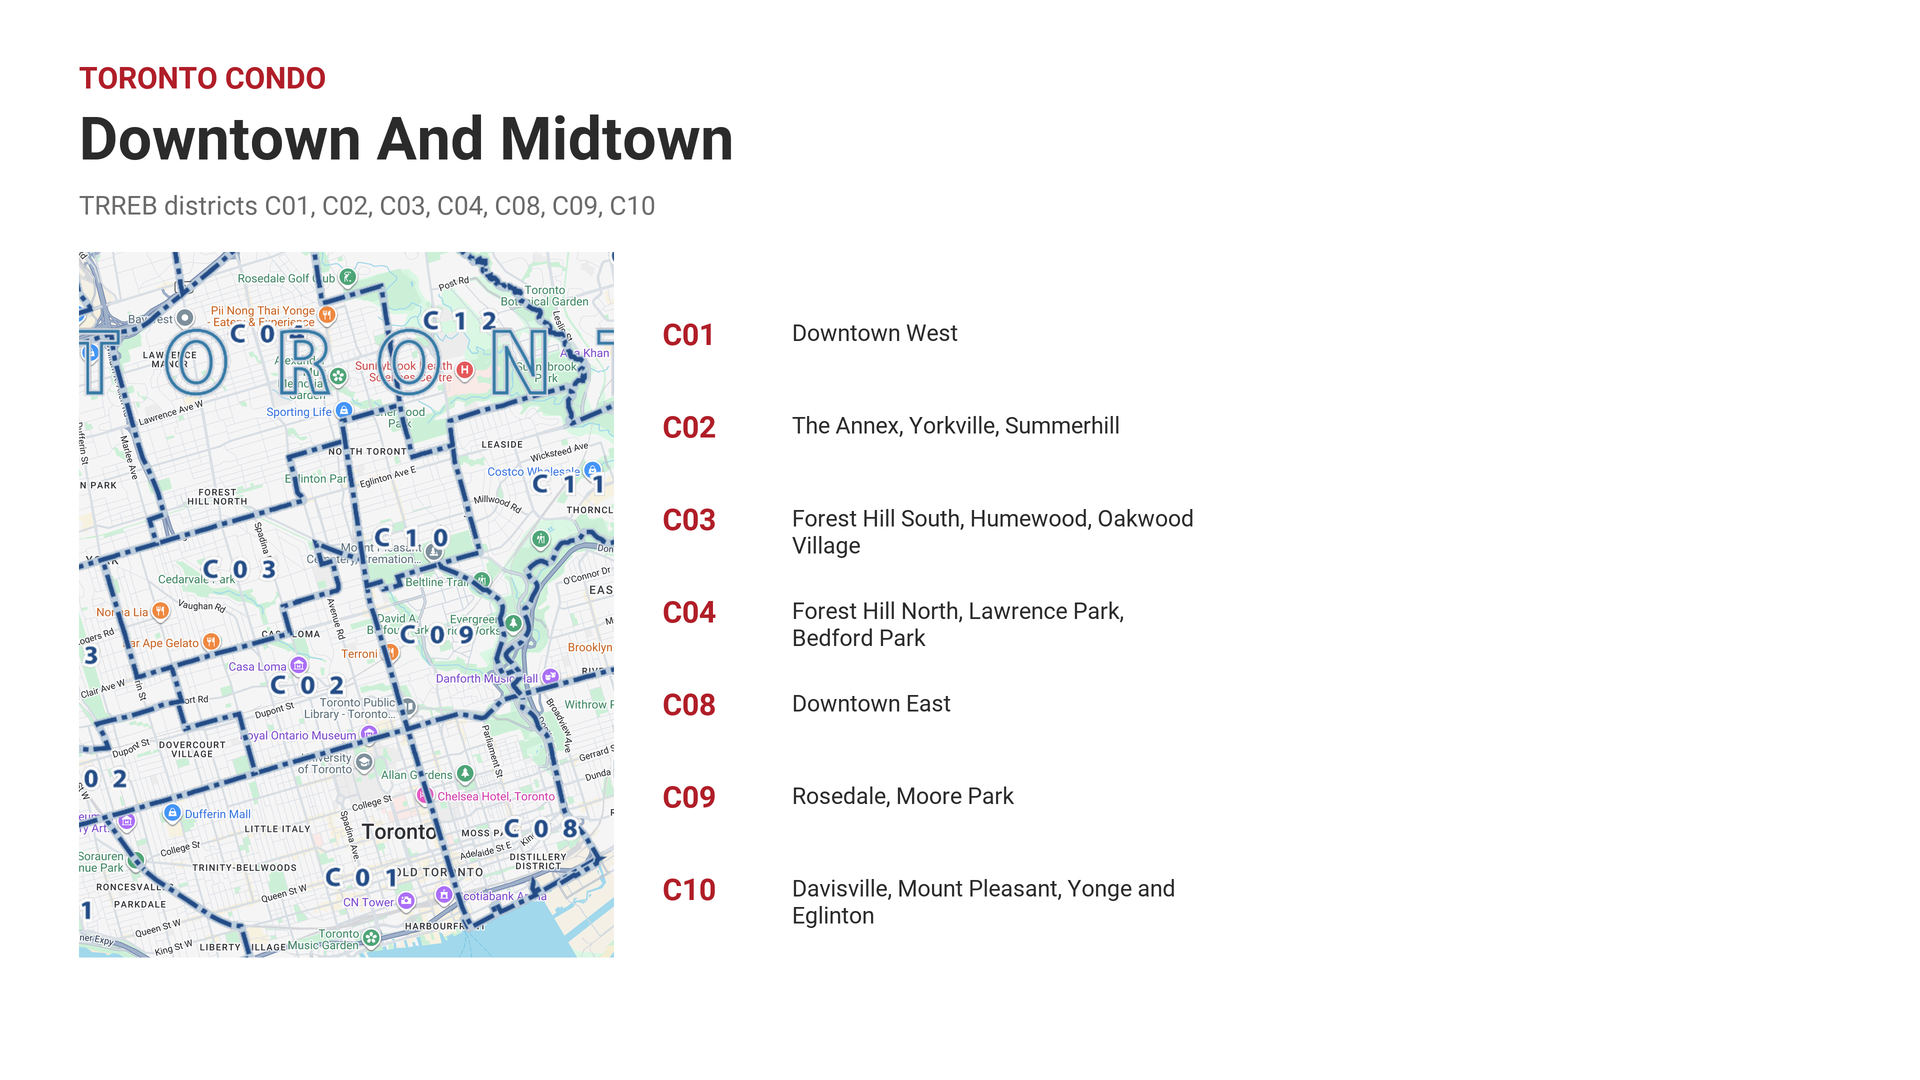
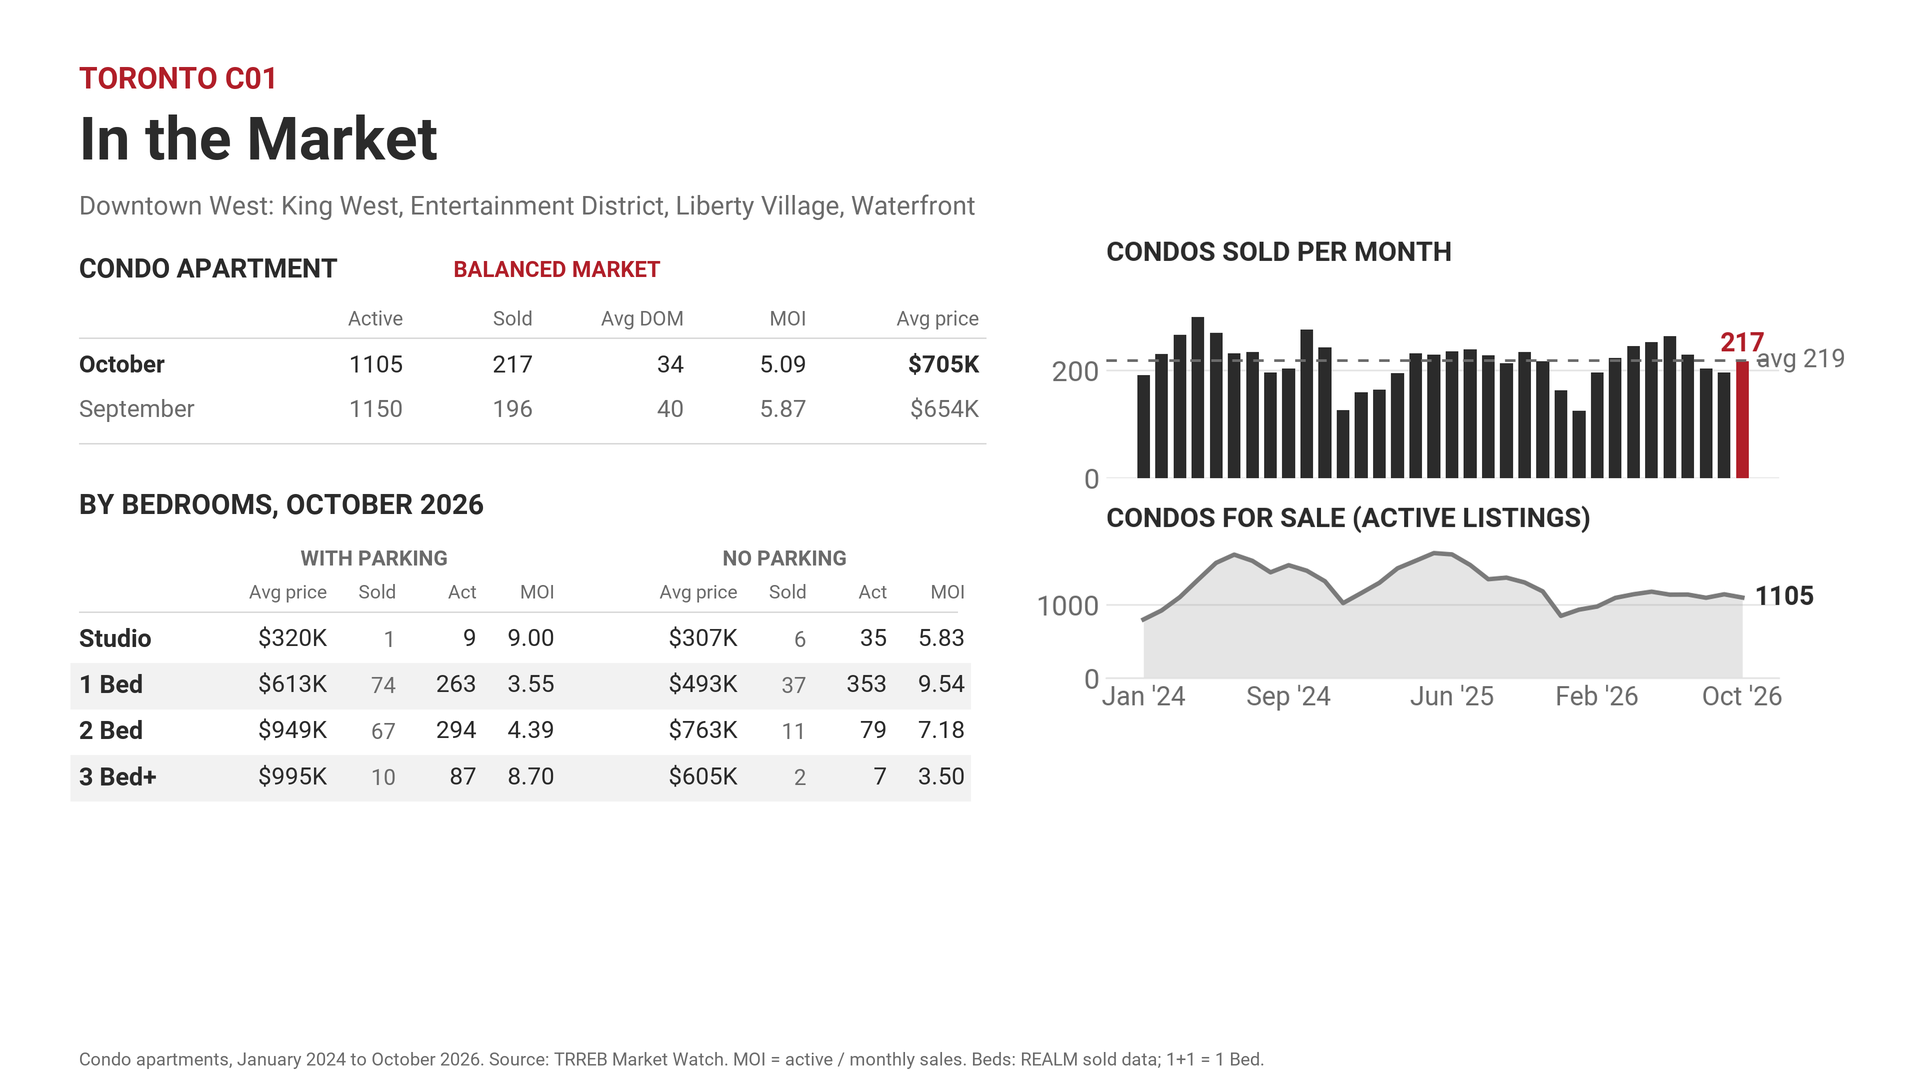
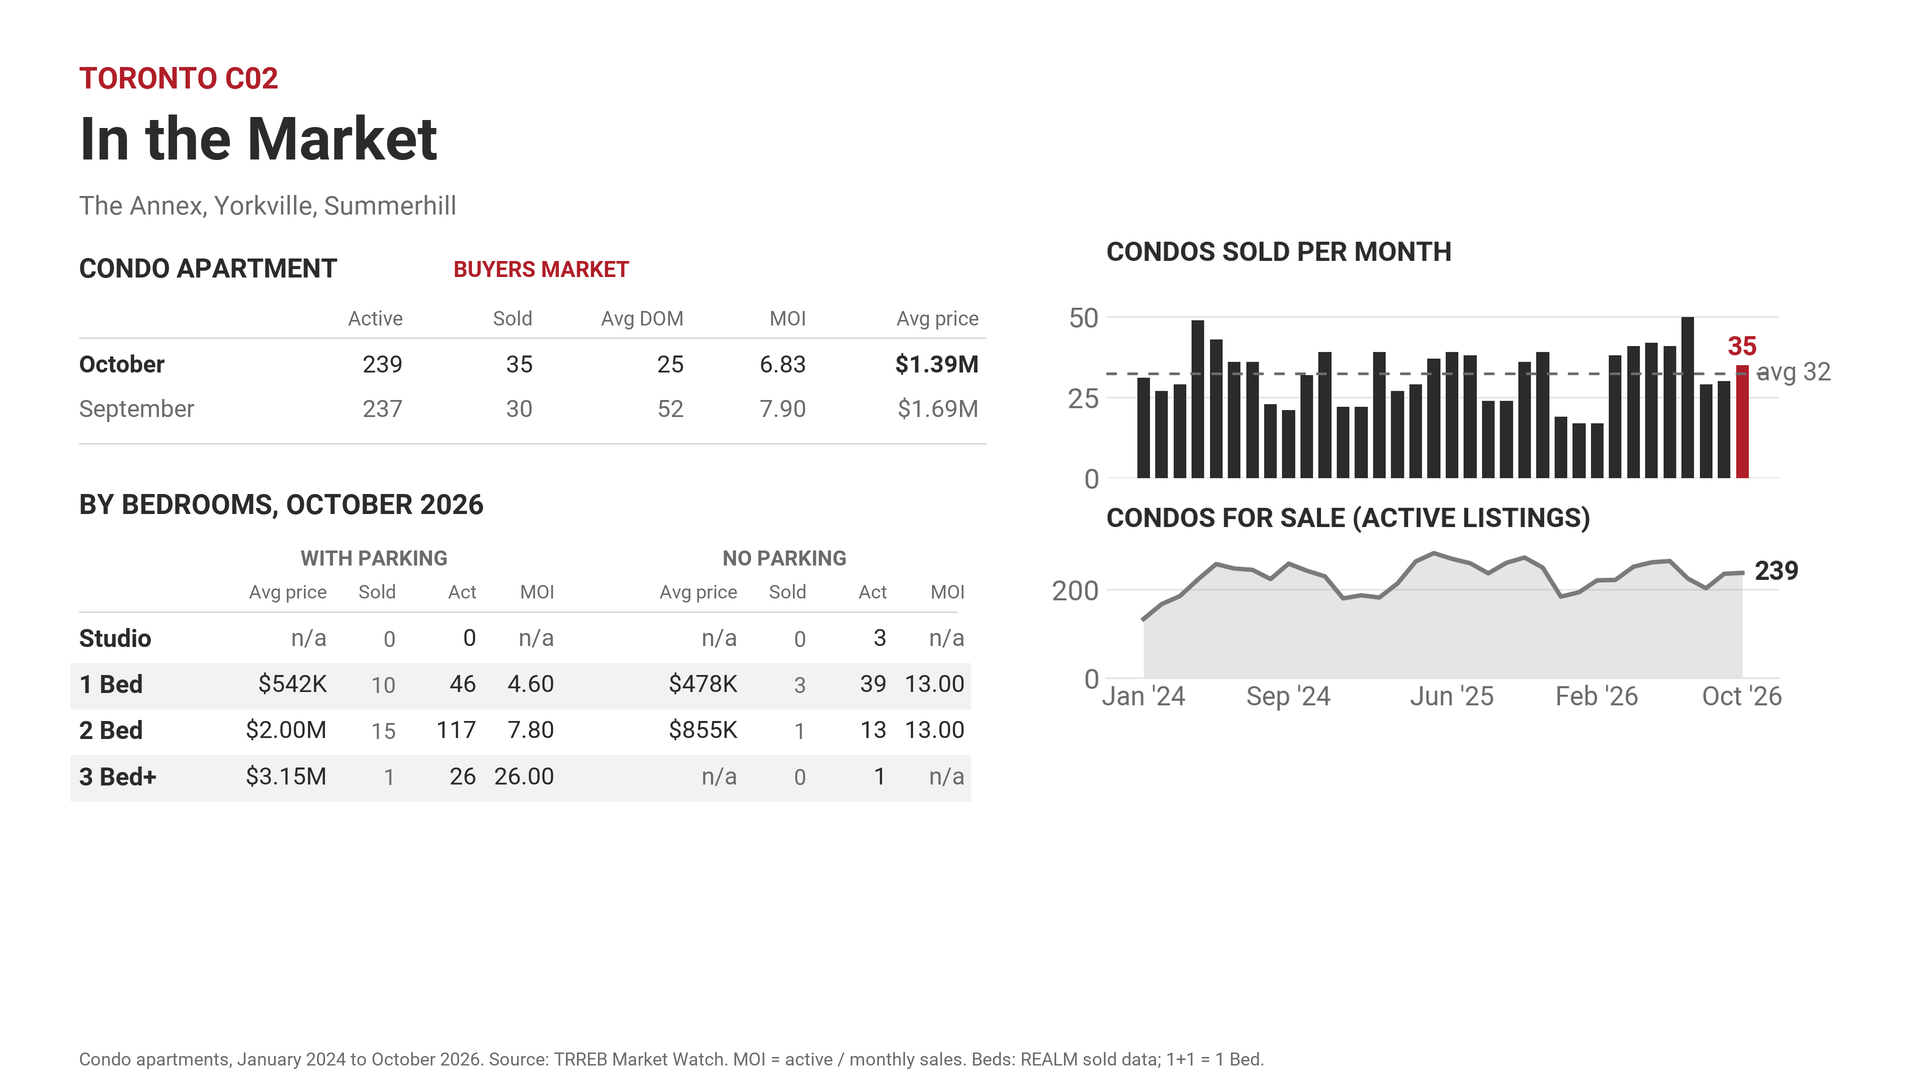
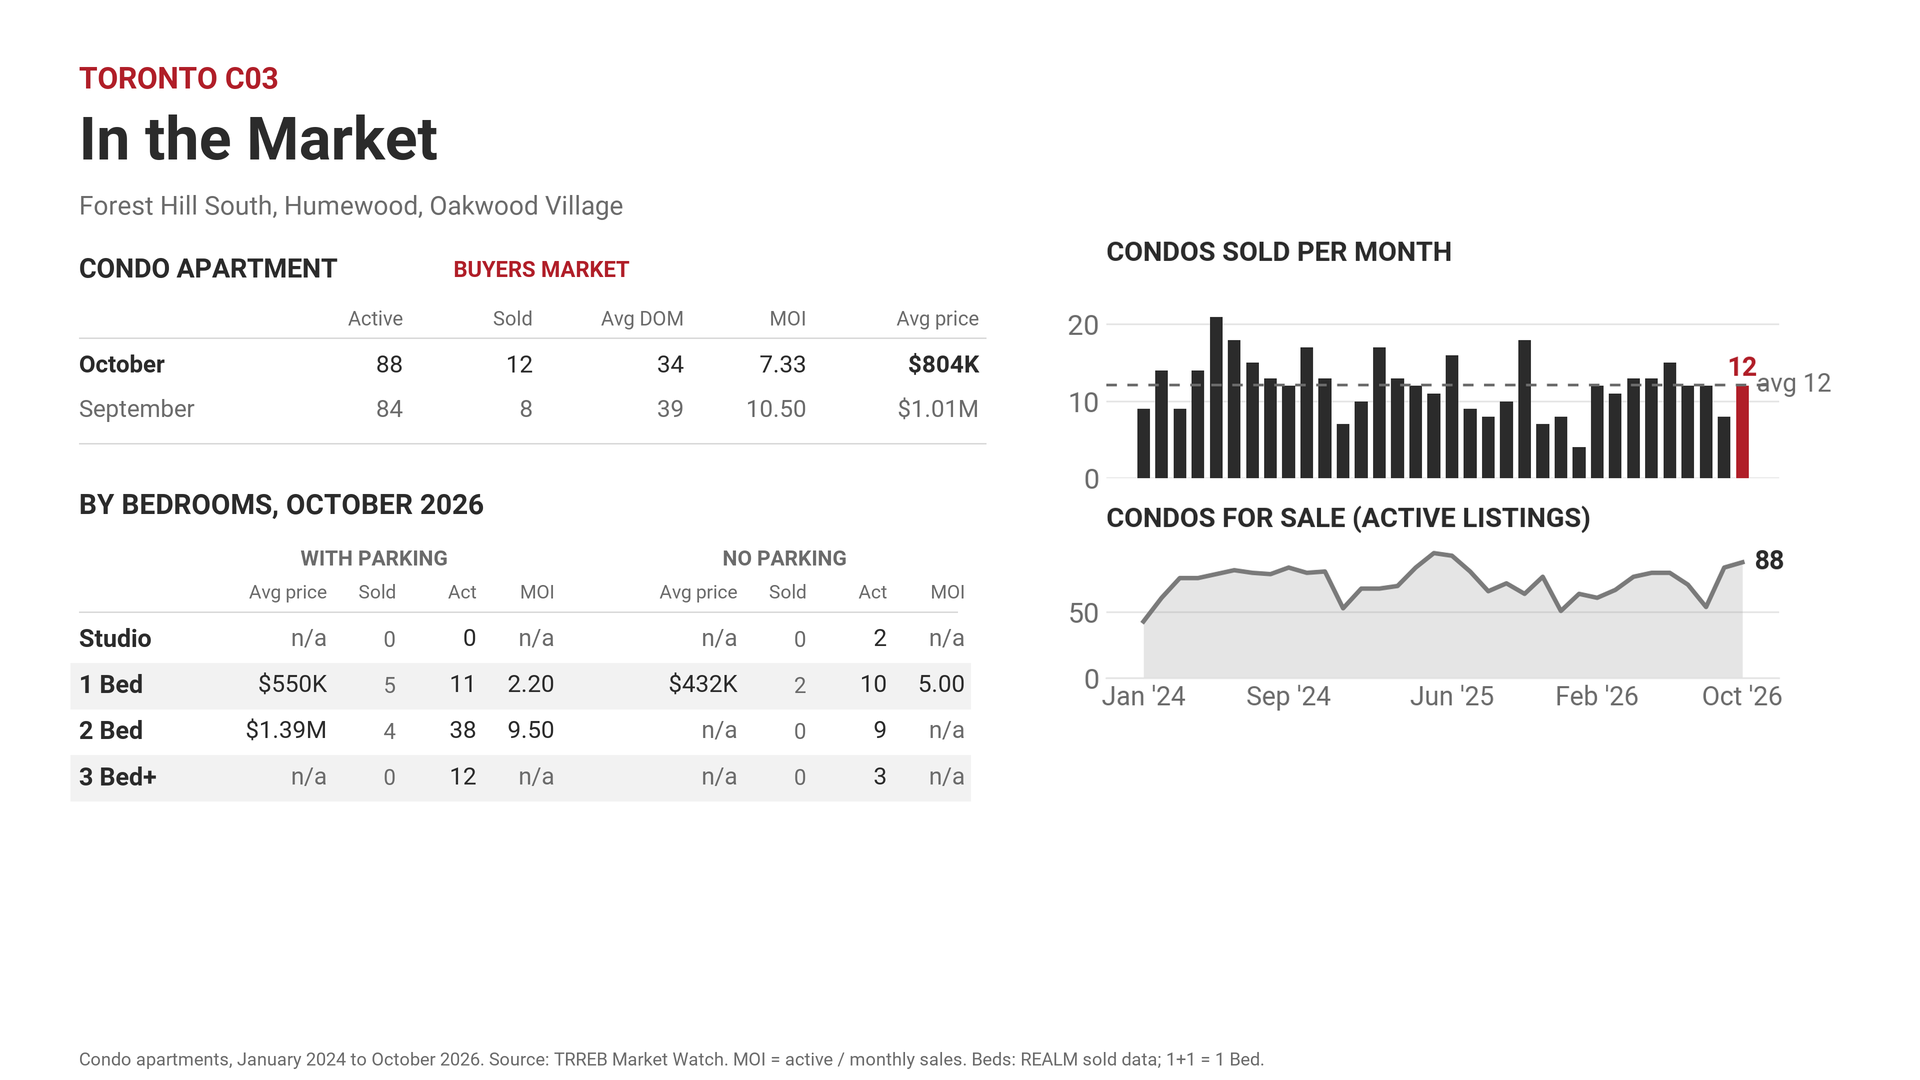
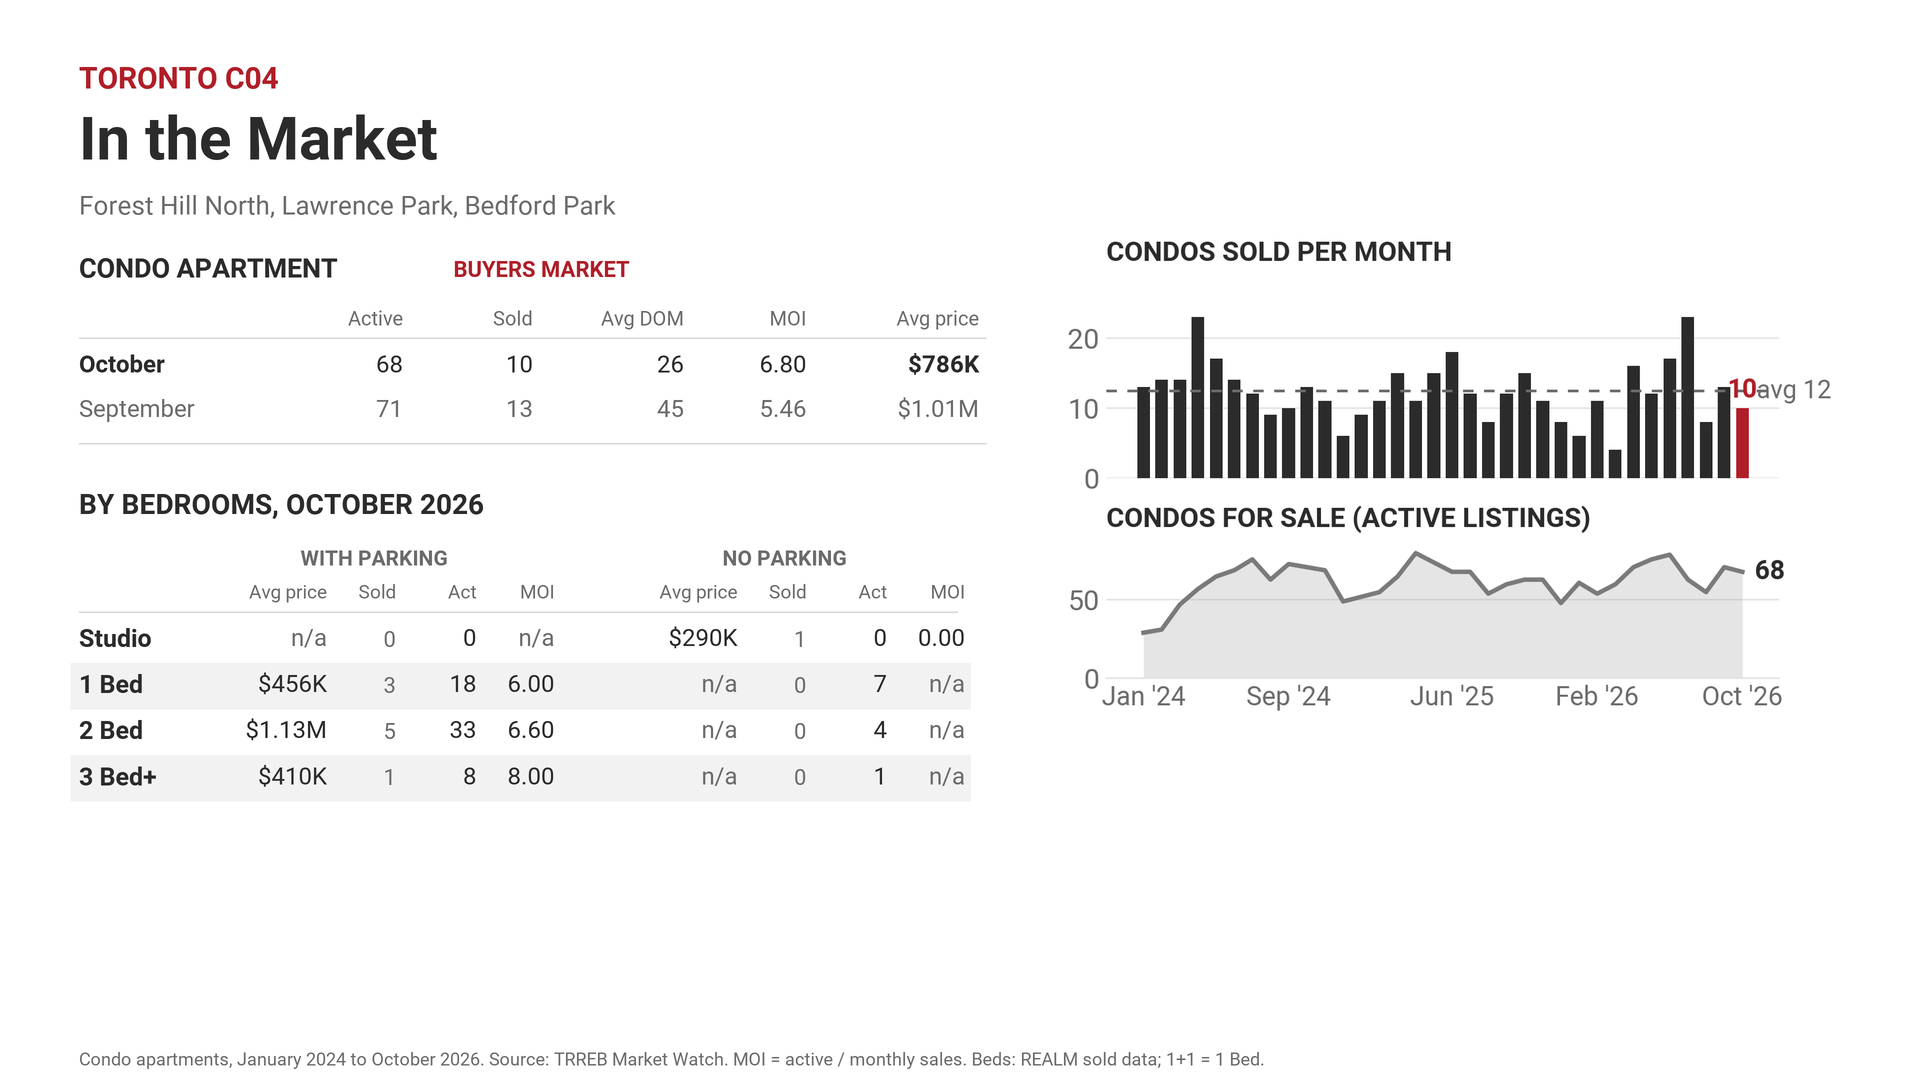
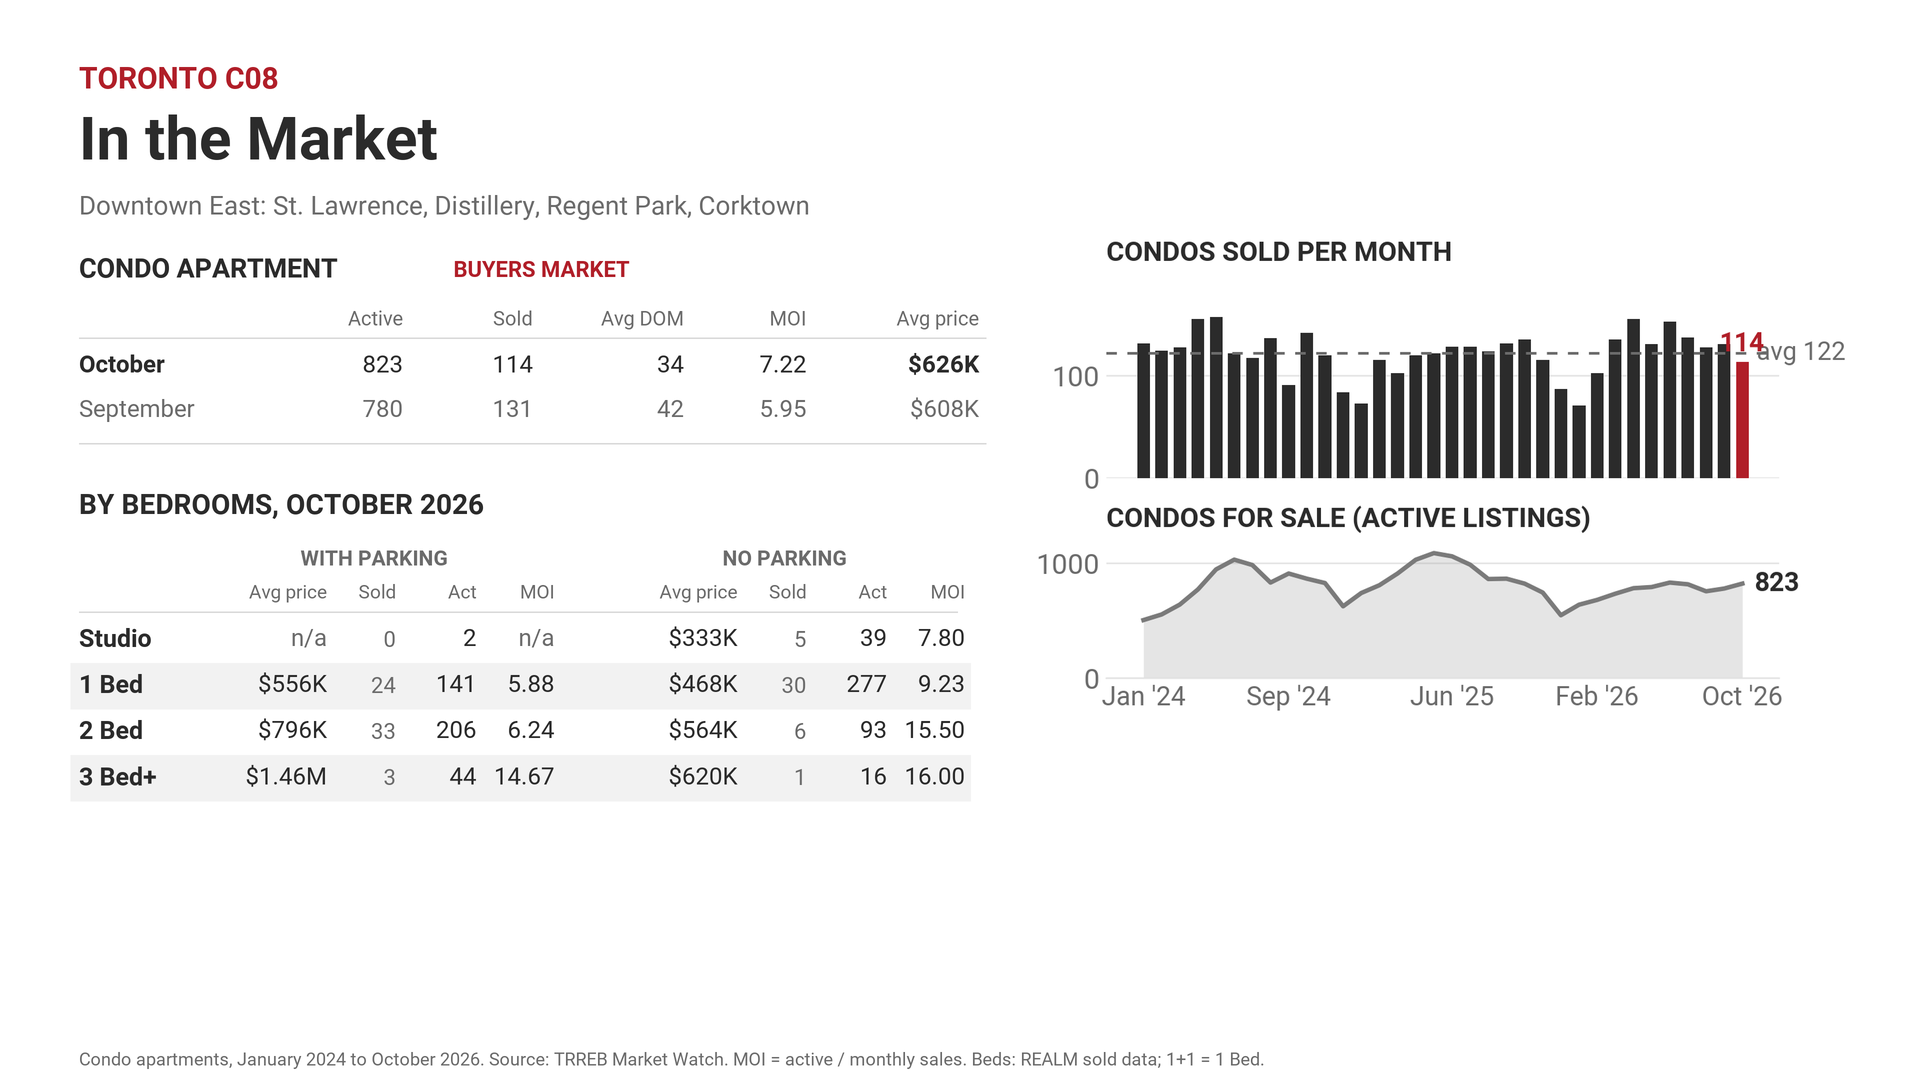
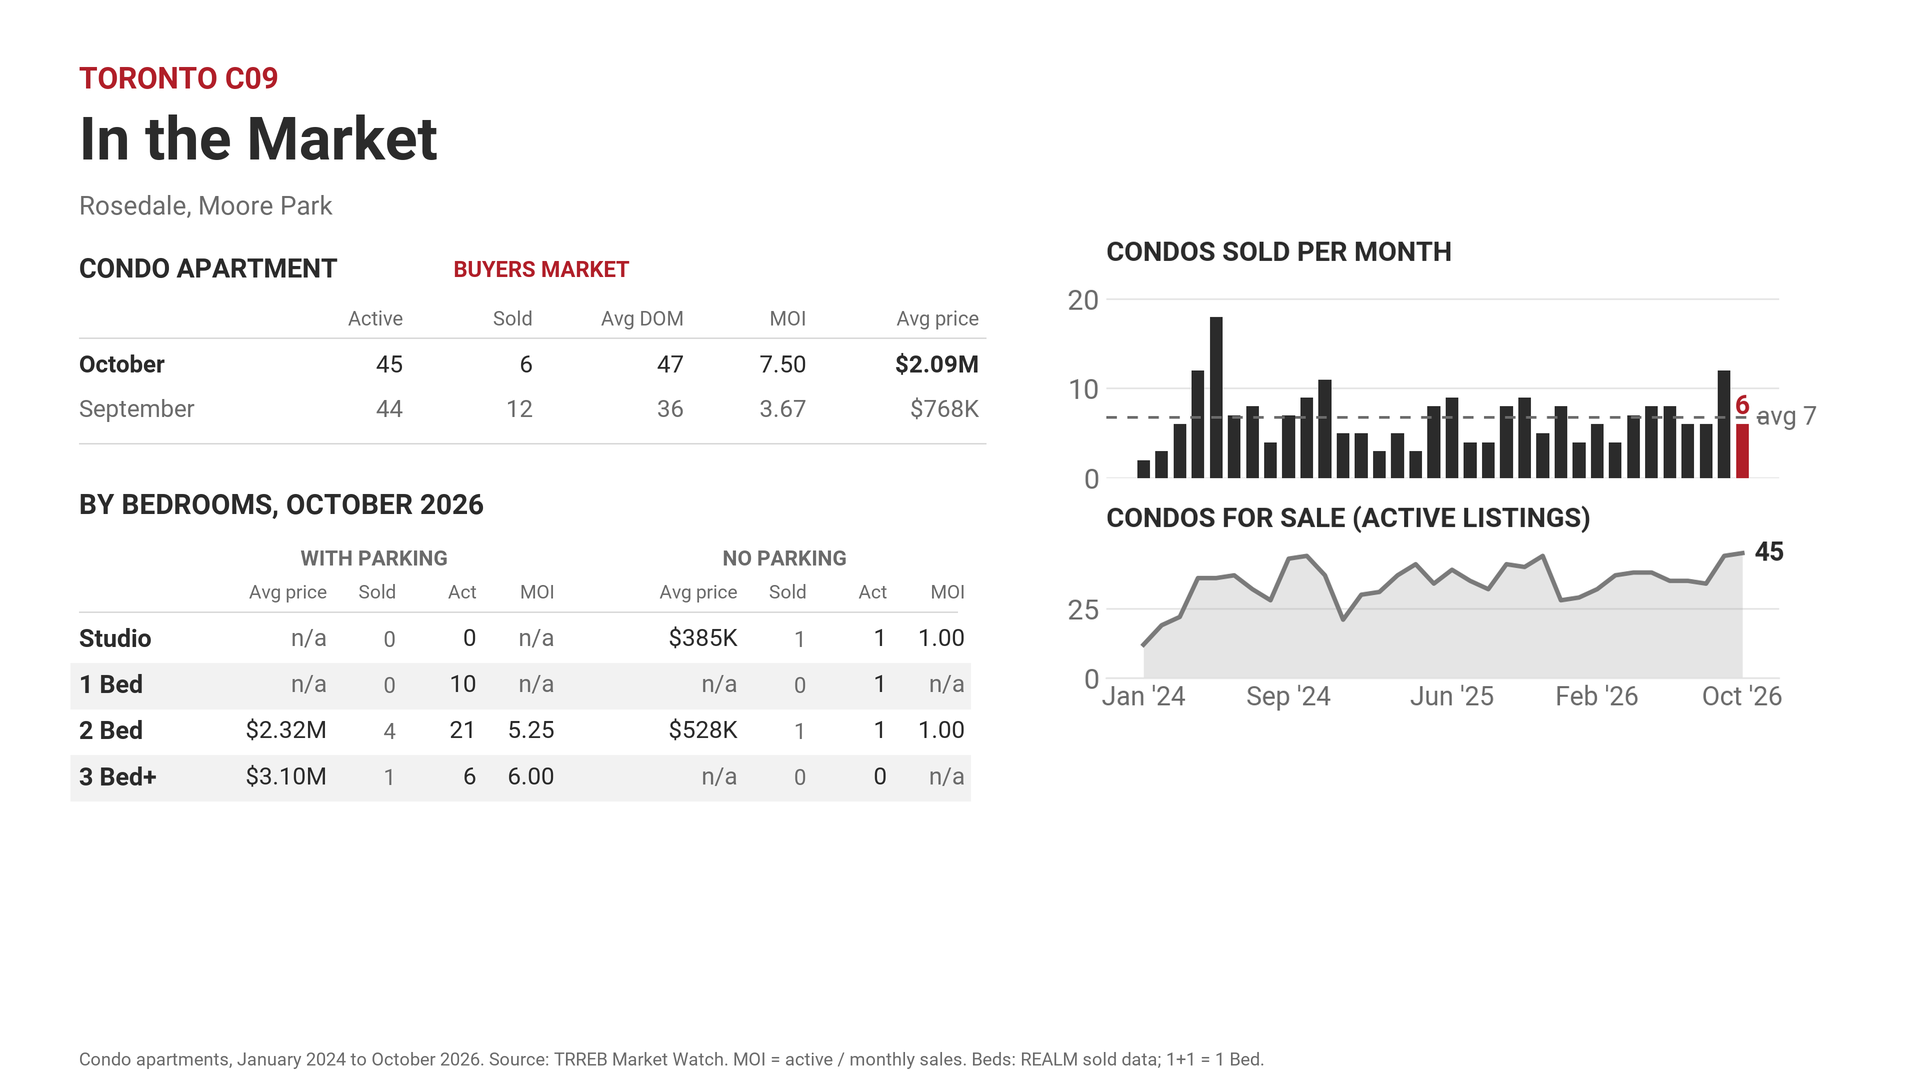
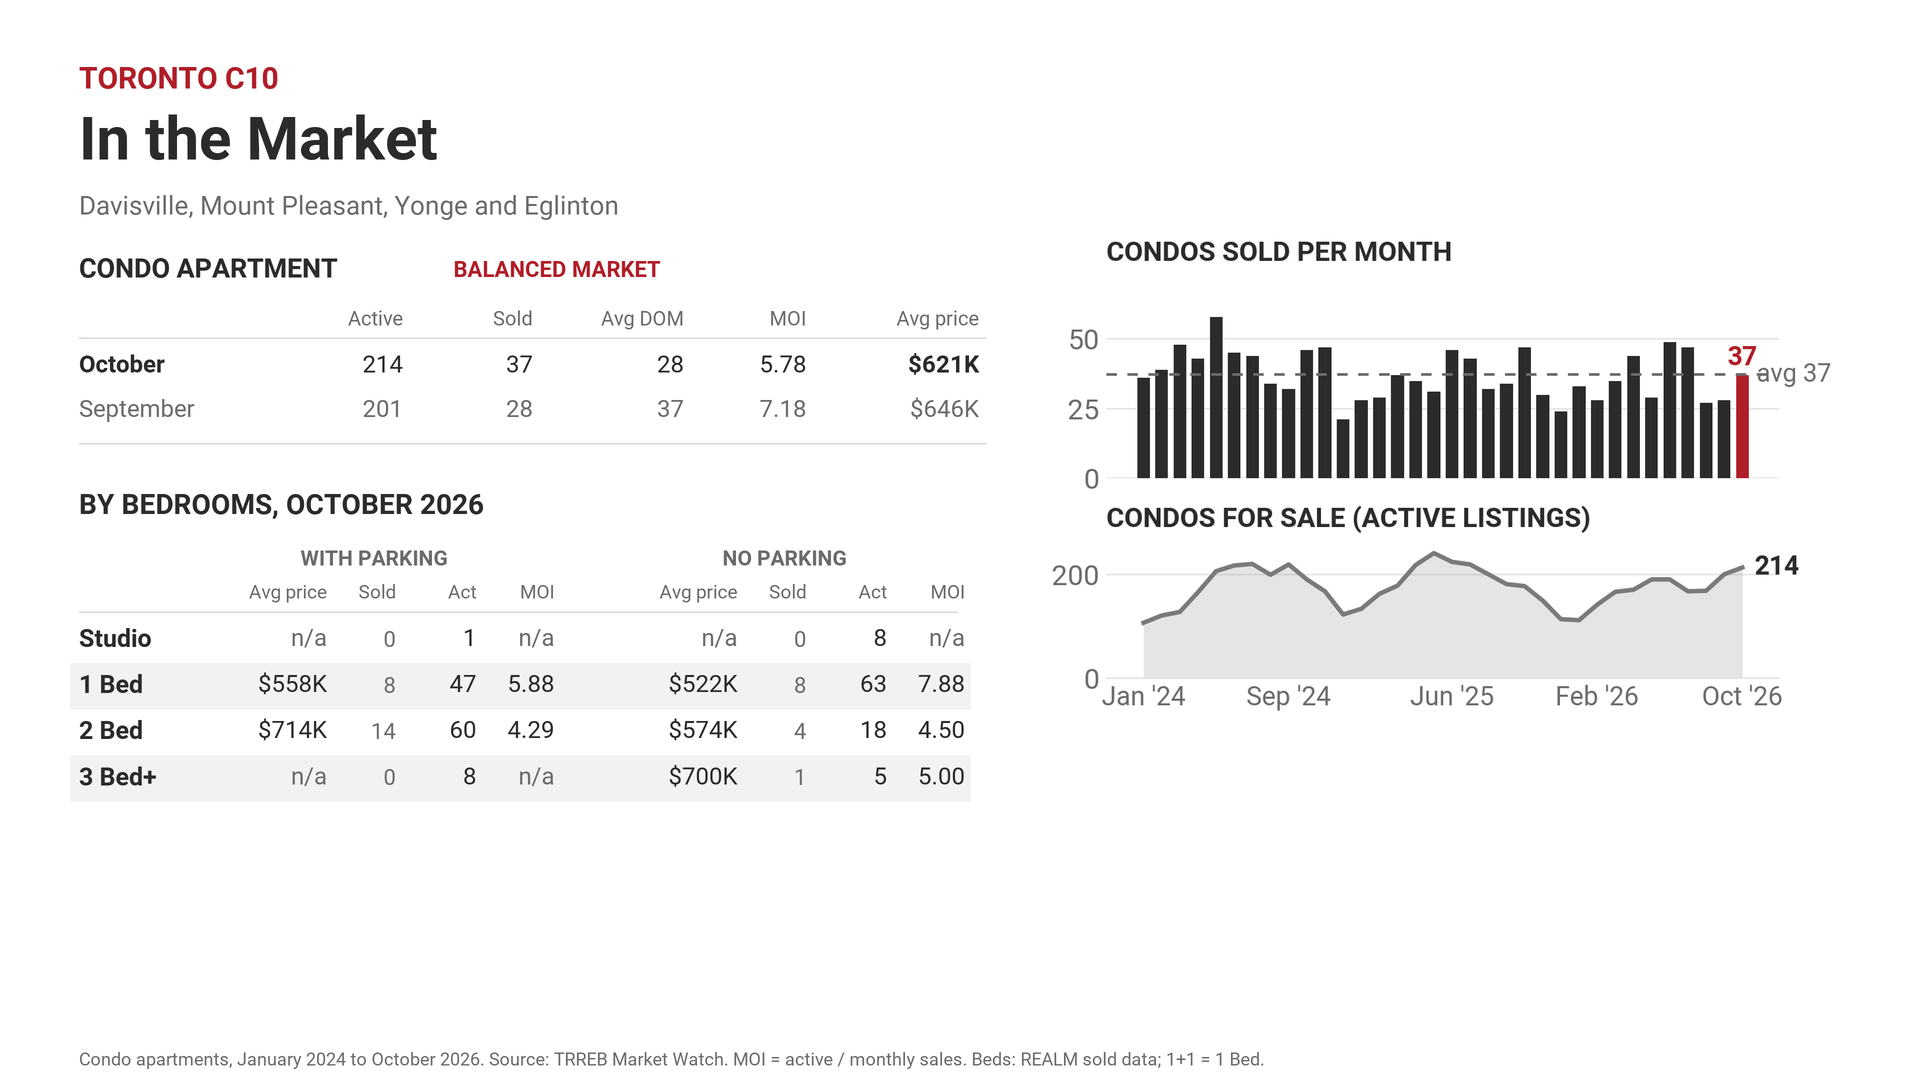
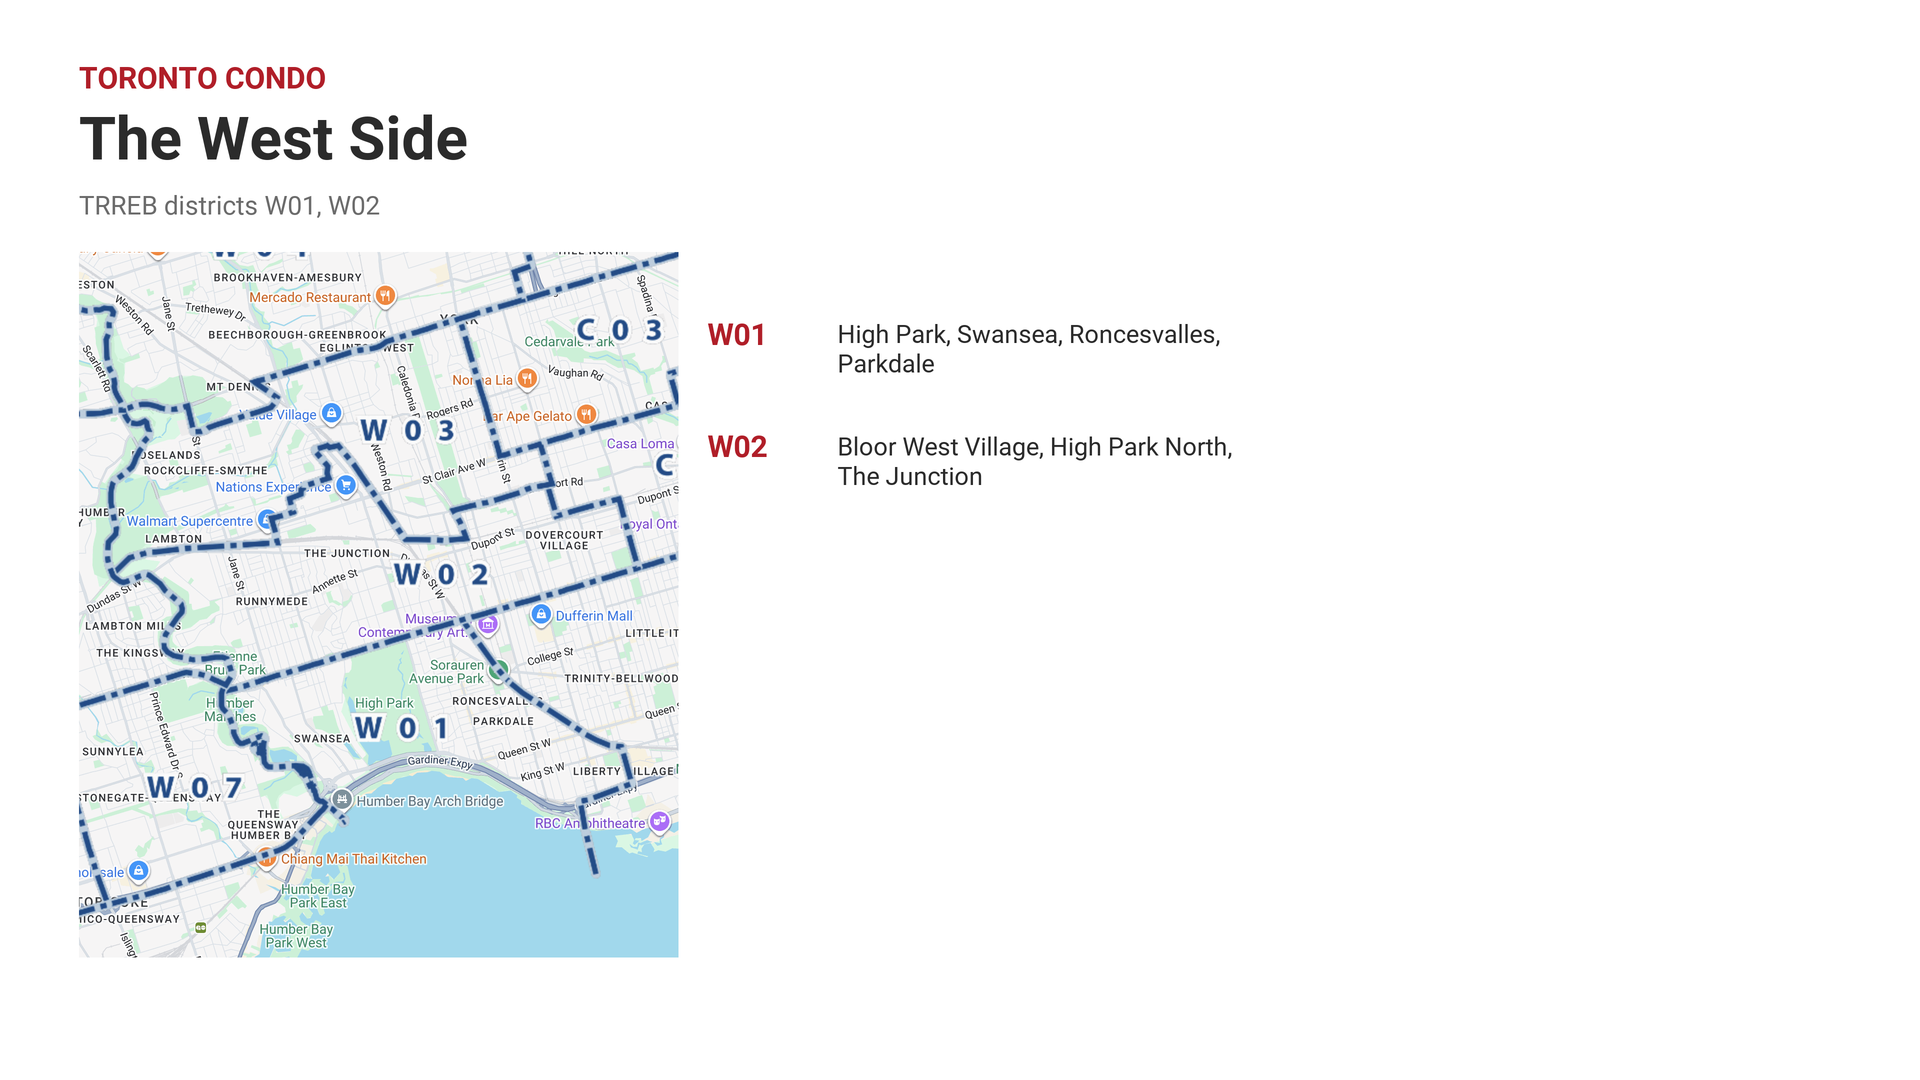
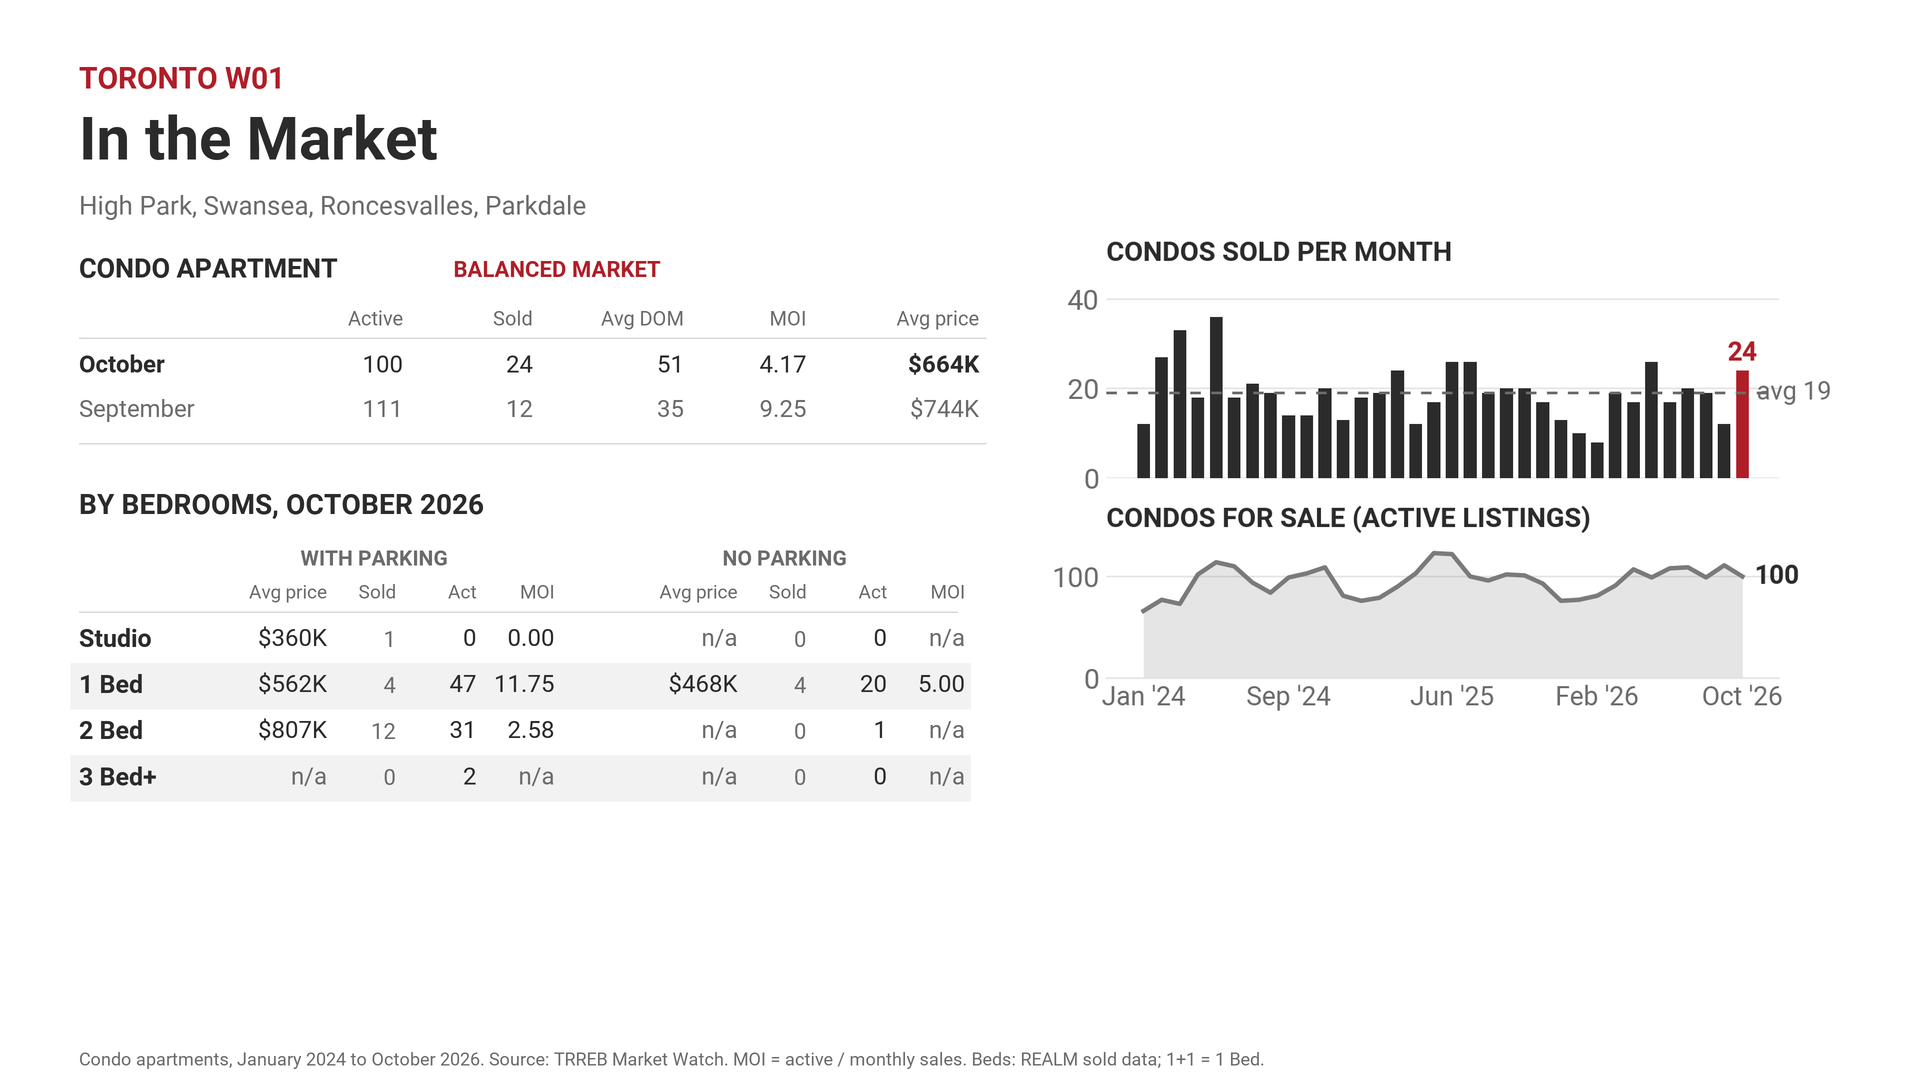
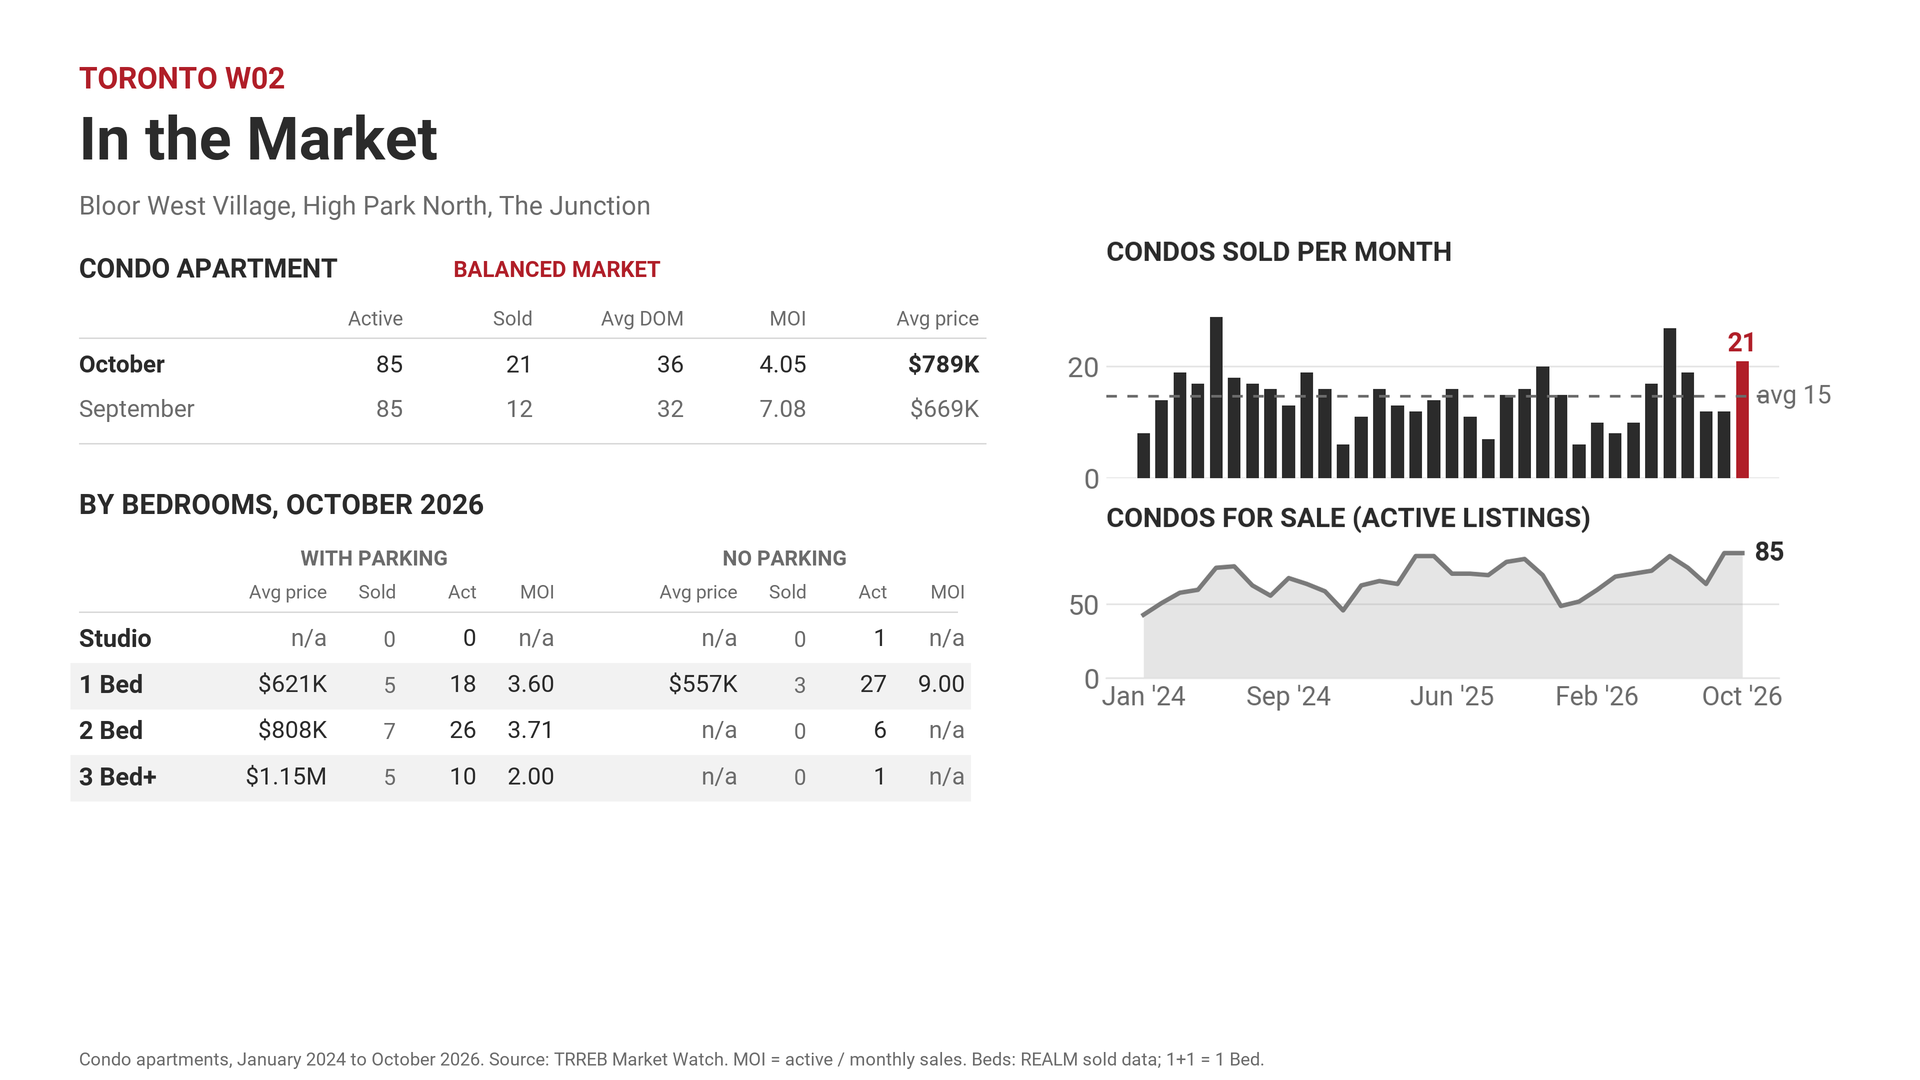
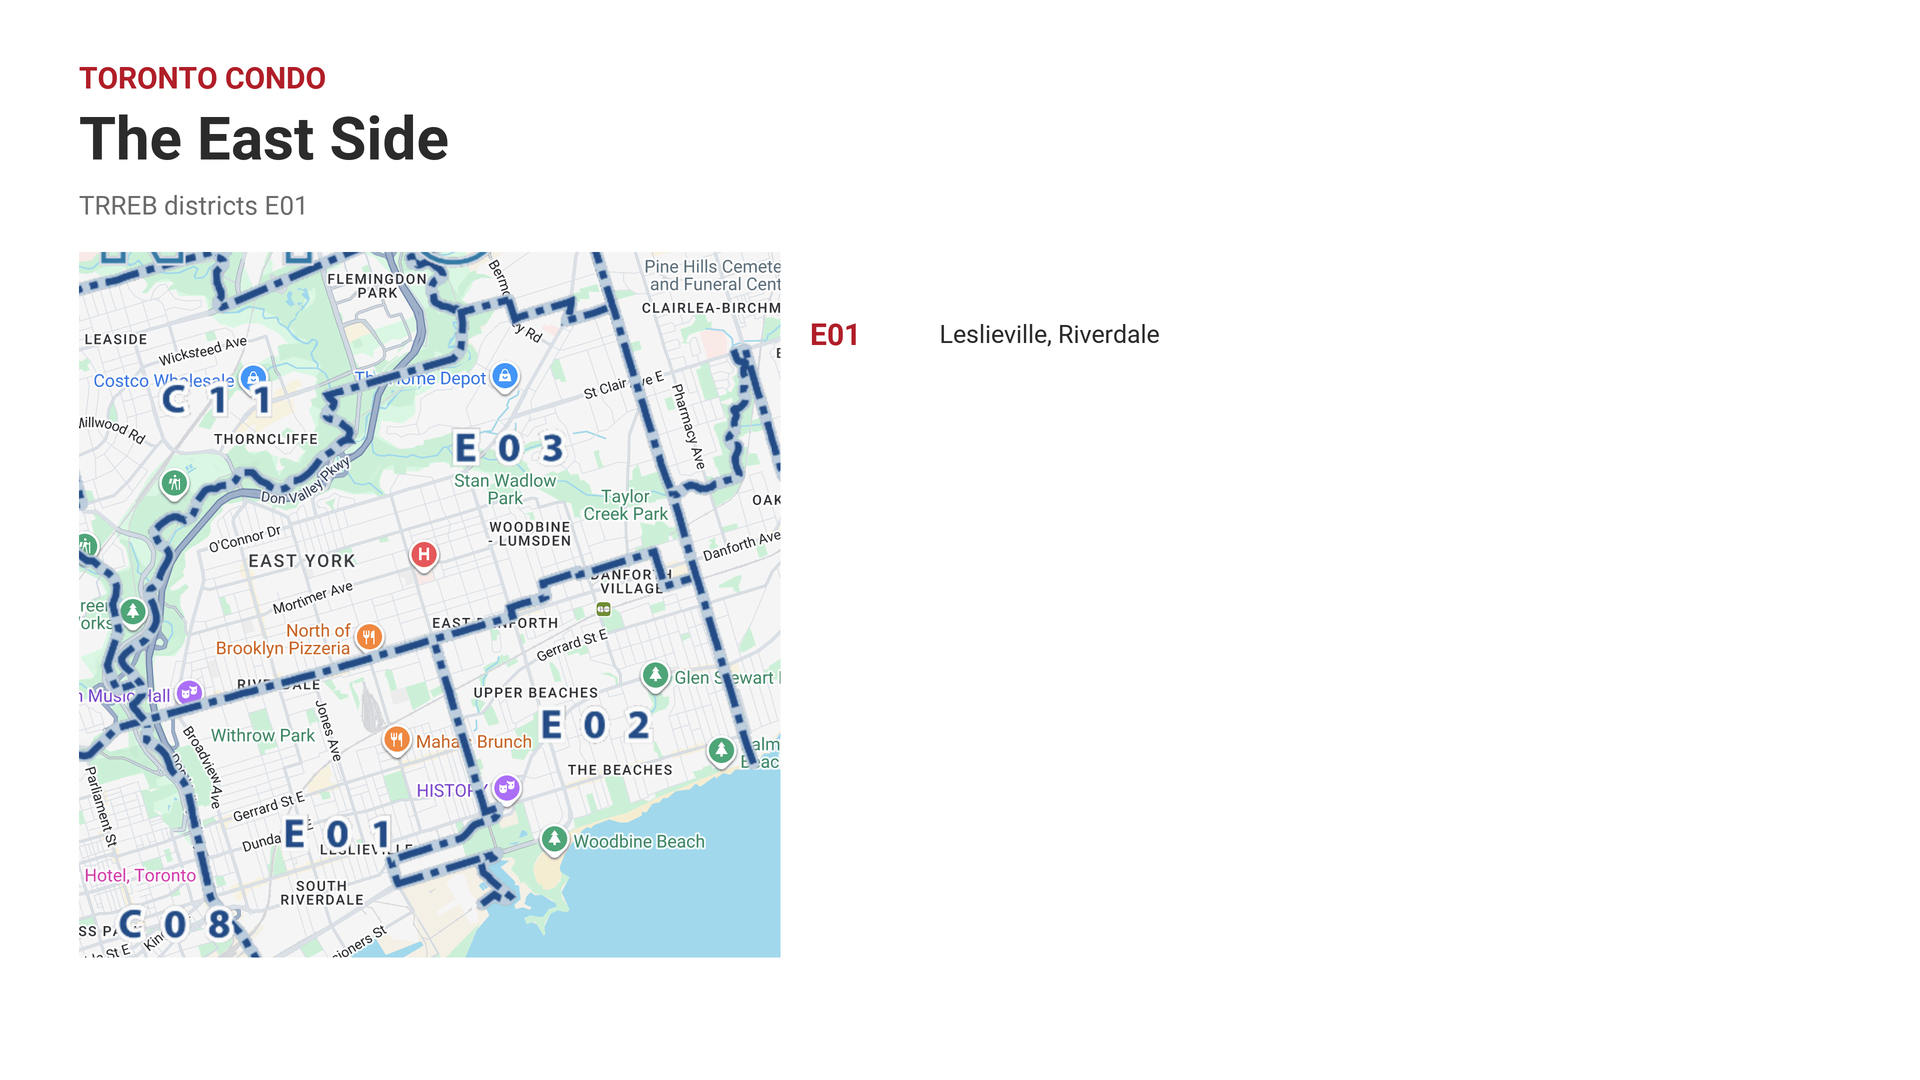
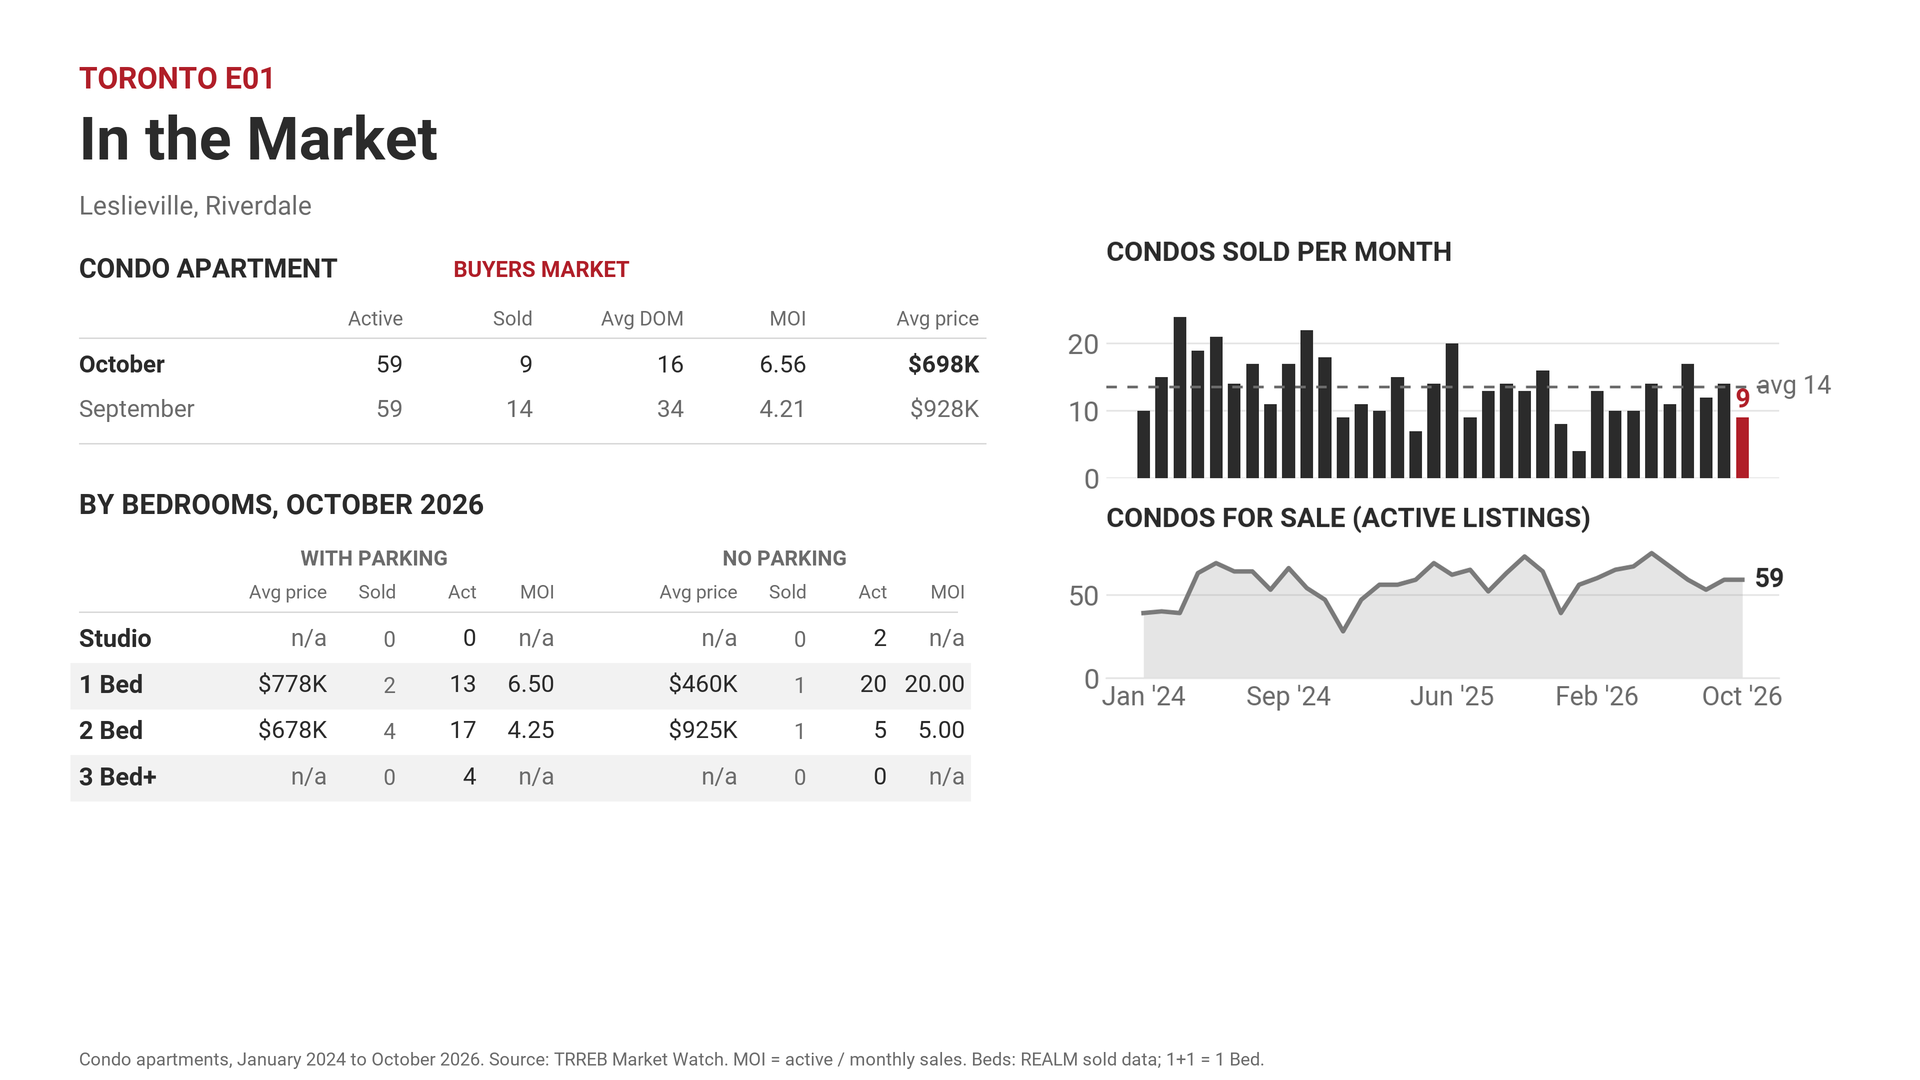
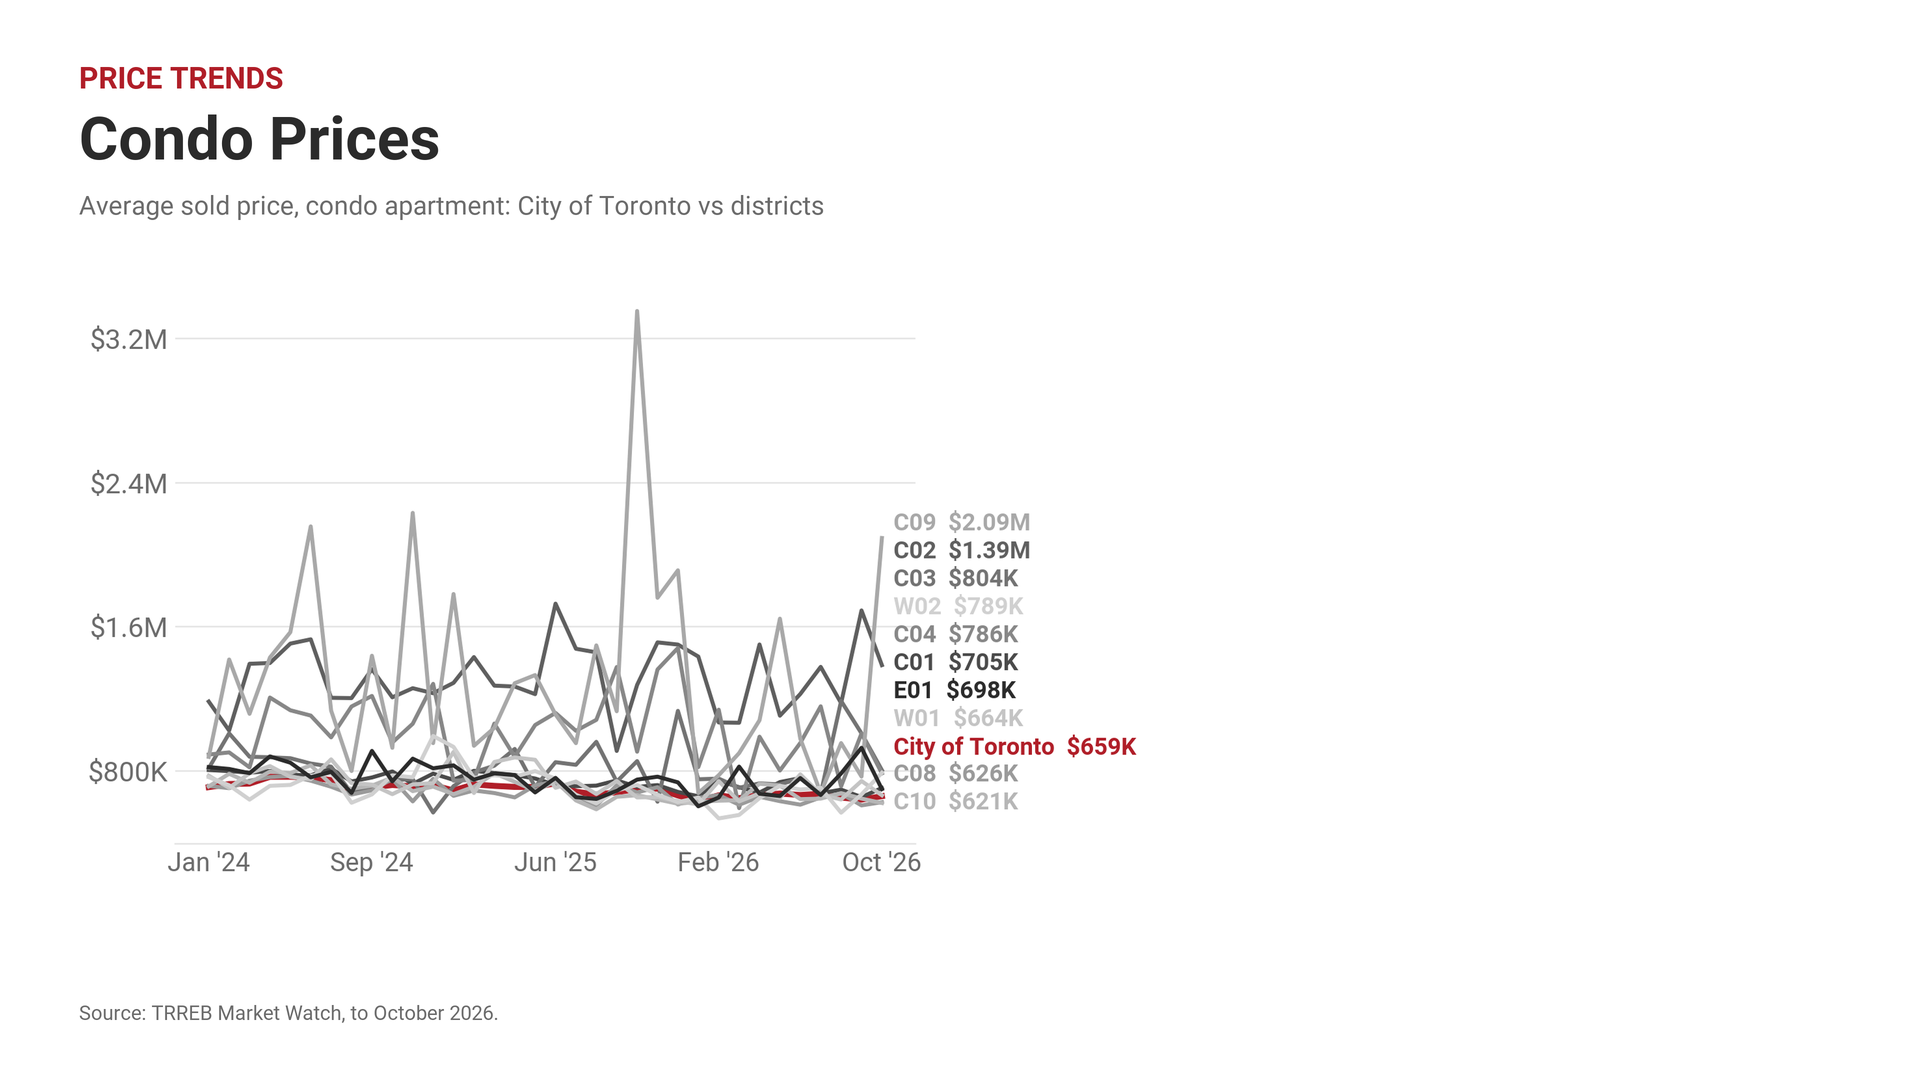
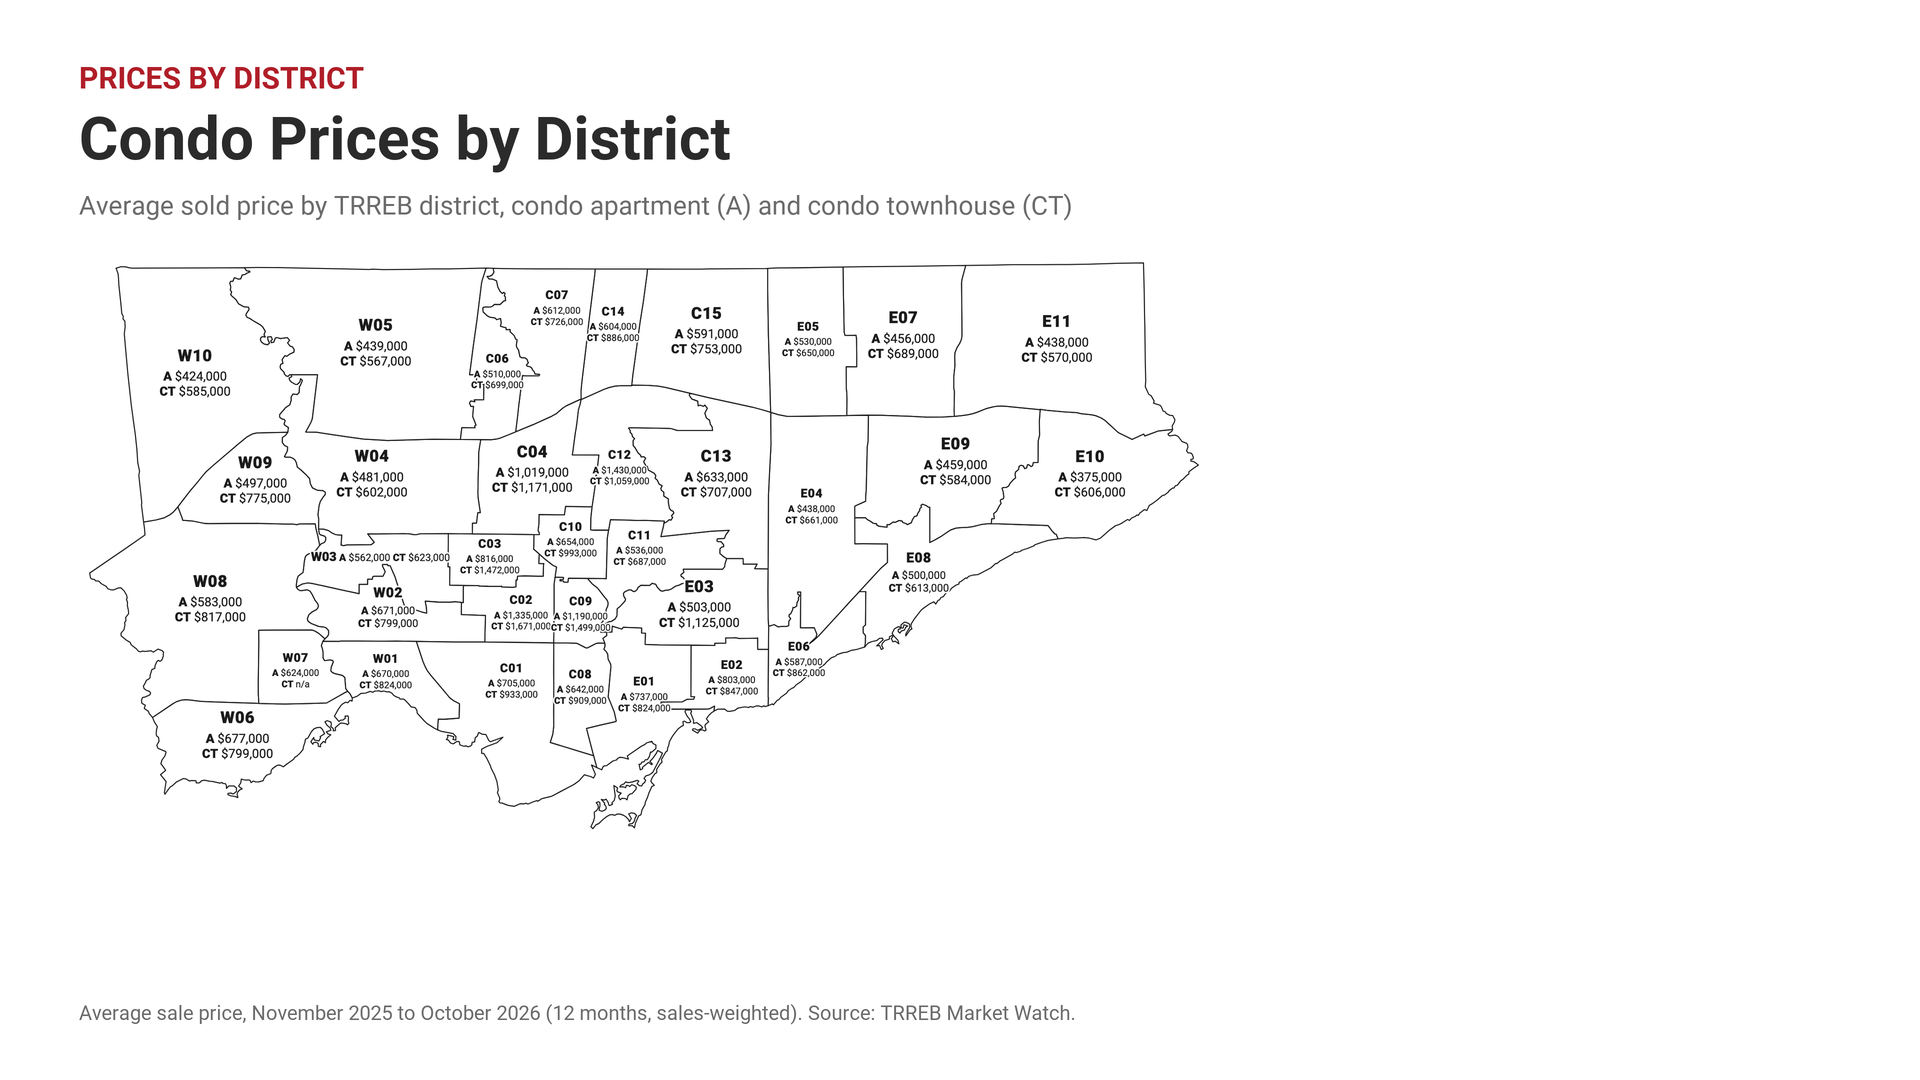
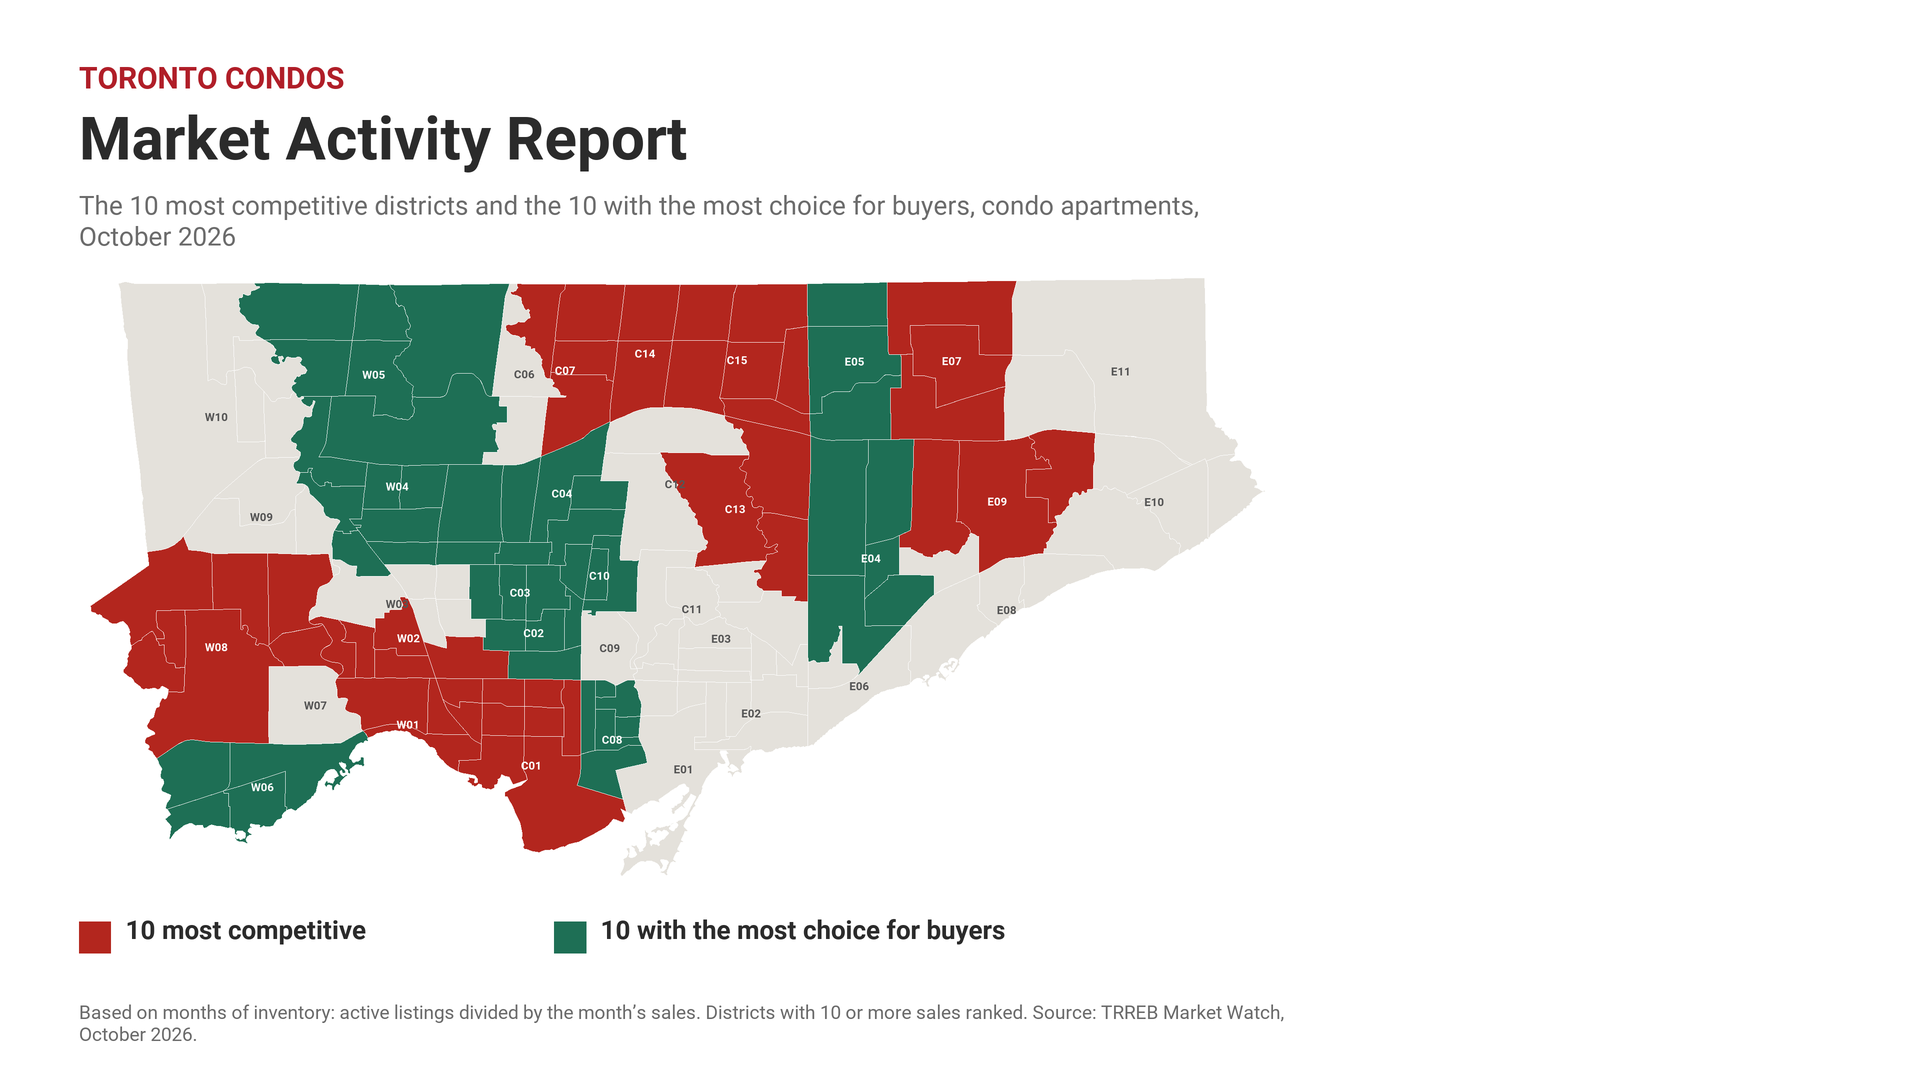
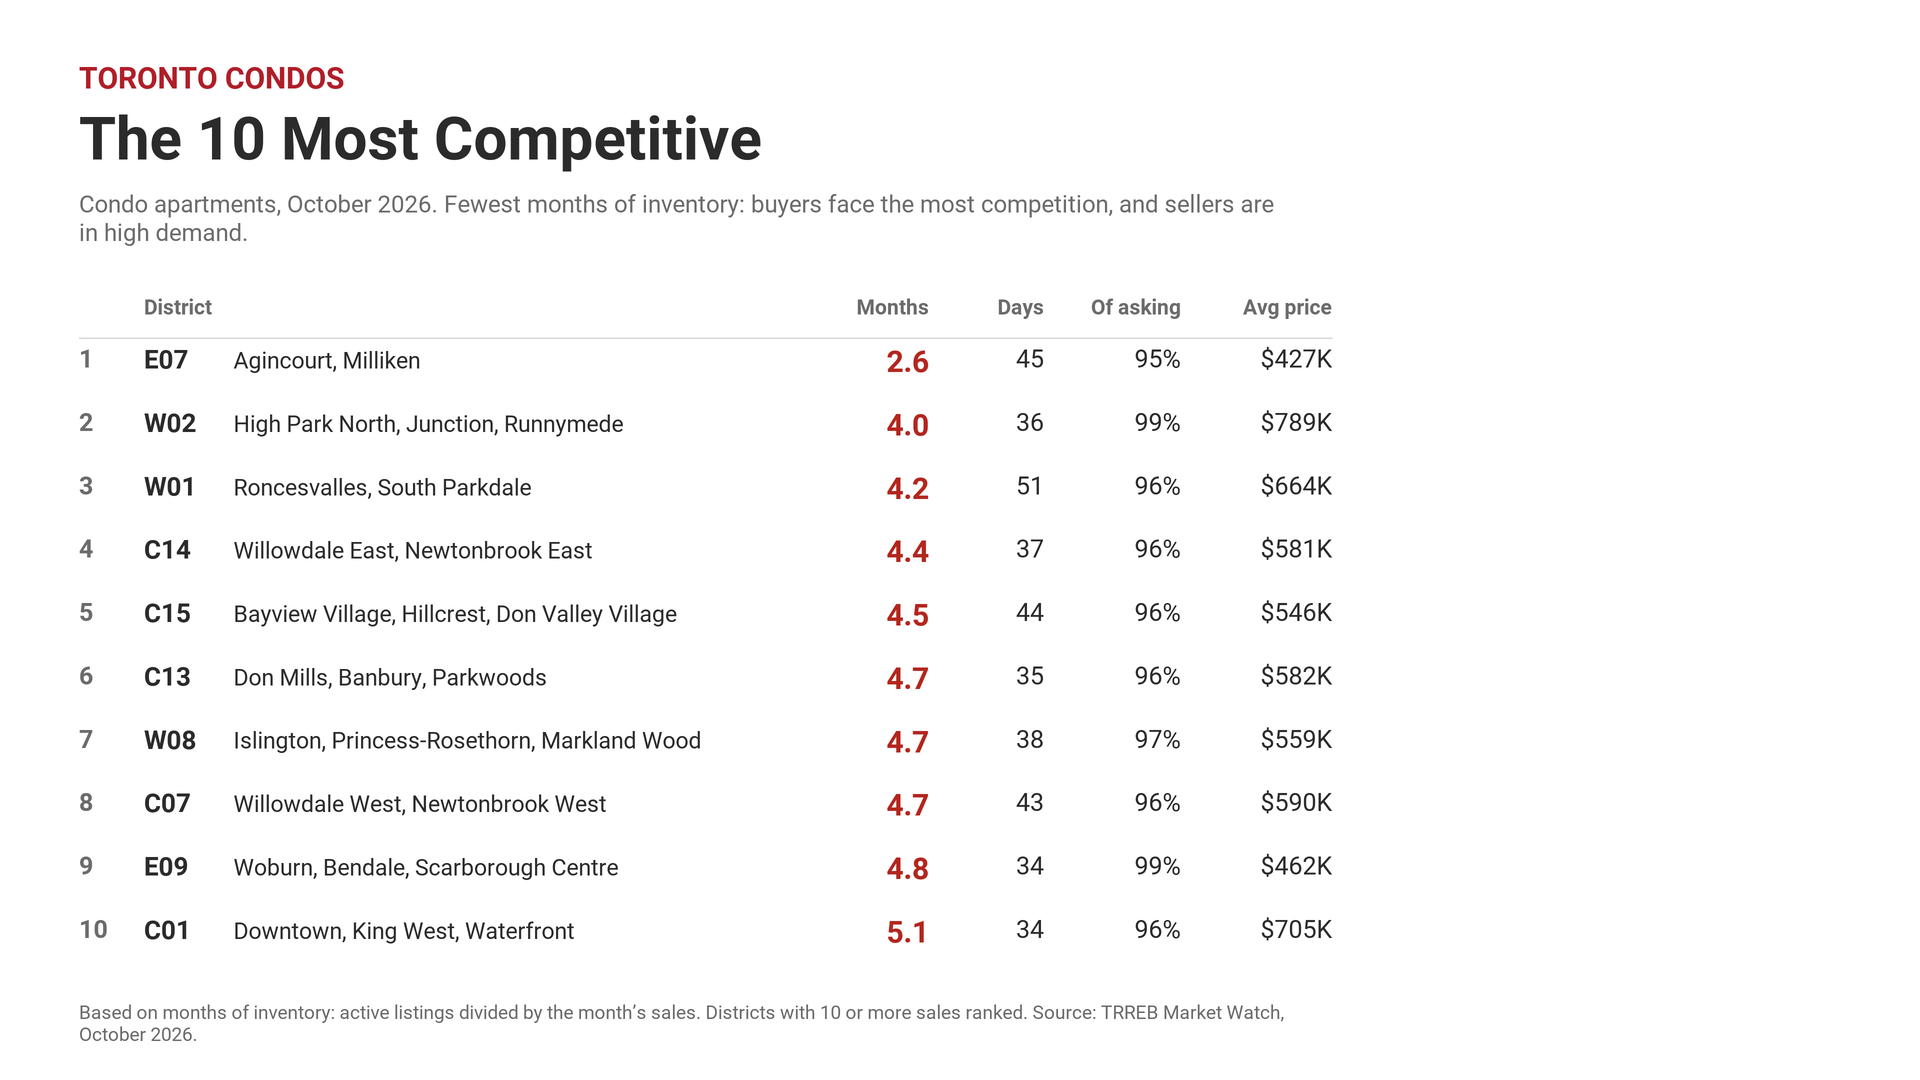
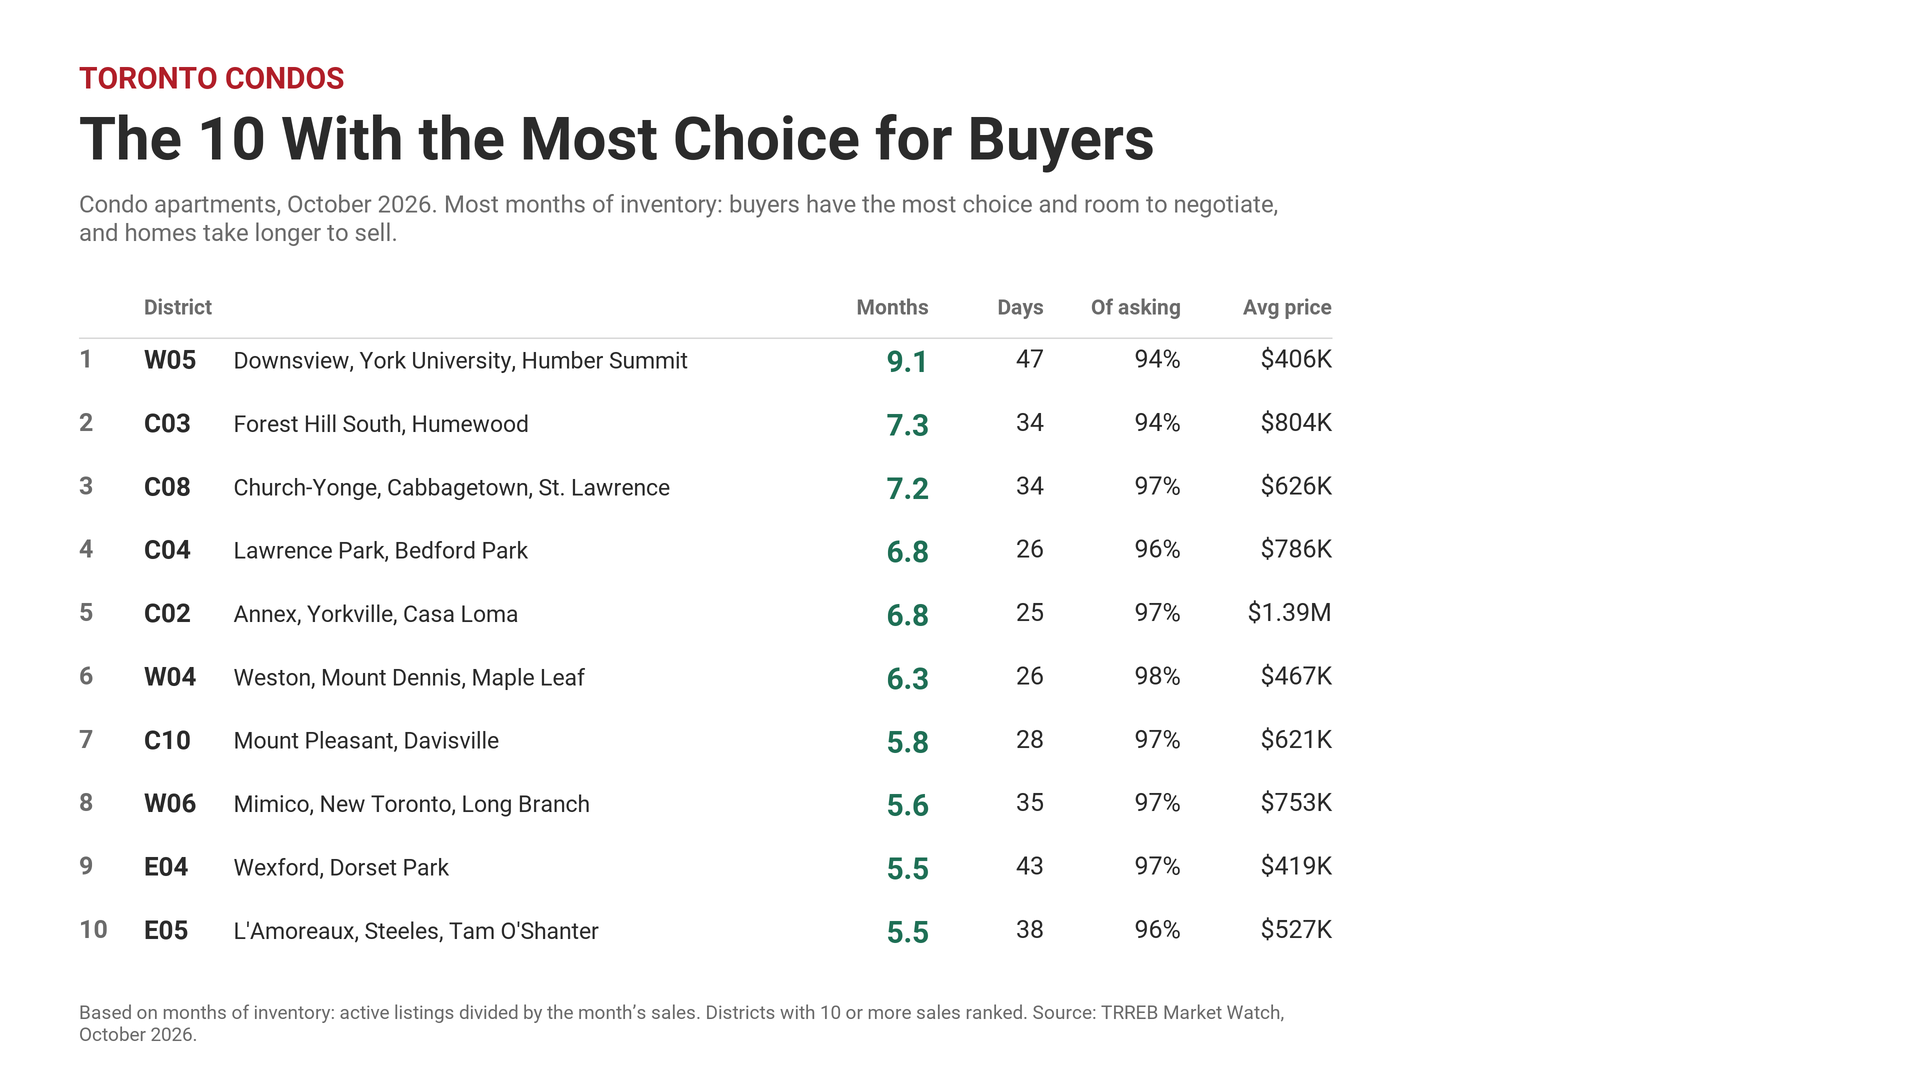
Source: TRREB Market Watch and MLS HPI public tables, October 2026. TRREB districts, not individual neighbourhoods.
What It Means
With 5,251 active listings against 949 October sales, buyers have 5.5 months of inventory to choose from. For owners, the units that sell are the ones priced on today’s comparables and presented properly. Either way, the play is specific to your building. Book a call with Michael to talk it through.
Latest video breakdown
Give Me 8 Minutes… I’ll Tell You The Truth About Toronto Condos (October 2026)
September 2026 Toronto condos: 884 sales, down 6.0% from last year, at an average of $640,248, with 6 months of inventory and 10.7% fewer listings.
Toronto Condo Market FAQ, October 2026
How are Toronto condos selling right now?
Over the 12 months from November 2025 to October 2026, 37% of 2-bed condos sold (buyer’s market), 34% of 1-bed condos sold (buyer’s market) and 27% of studio condos sold (buyer’s market), in the City of Toronto. That is the share of new listings that sold (the sell rate): 60% and up is a seller’s market, 40 to 59% balanced, under 40% a buyer’s market. In October 2026, 949 condo apartments sold in the City of Toronto against 5,251 active listings, 5.5 months of inventory, according to TRREB Market Watch.
Are condo prices in Toronto still dropping?
In October 2026, the average condo apartment in the City of Toronto sold for $659,214, down 5.6% from October 2025 and up 3.0% from September 2026. The median was $545,000. The highest monthly average since 2011 was $831,351 in March 2022; October 2026 was 20.7% below it, according to TRREB Market Watch.
What is the current state of the condo market in Toronto?
In October 2026, 949 condo apartments sold in the City of Toronto, down 10.7% from October 2025, with 2,694 new listings and 5,251 active listings: 5.5 months of inventory. Condos took 36 days to sell on average, at 97% of the asking price. The average price was $659,214, down 5.6% from October 2025, according to TRREB Market Watch.
What is the average condo price in Toronto?
In October 2026, the average condo apartment in the City of Toronto sold for $659,214, down 5.6% from October 2025. The median price was $545,000, and 949 condos sold during the month, according to TRREB Market Watch.
How much does a one-bedroom or two-bedroom condo cost in Toronto?
By the Michael Ouzas Real Estate Team’s own count of October 2026 MLS® sales, one-bedroom condos with parking averaged $518,644 (267 sales) and those without parking $477,989 (96 sales). Two-bedroom condos with parking averaged $794,247 (399 sales) and those without parking $669,999 (26 sales).
Does parking affect what a Toronto condo sells for?
In October 2026, two-bedroom condos with parking sold for an average of $794,247 against $669,999 without, a difference of $124,248. For one-bedrooms the difference was $40,655. Supply differs too: two-bedrooms had 5.1 months of inventory with parking and 10.4 without; one-bedrooms had 5.1 with and 10.0 without. Figures are the Michael Ouzas Real Estate Team’s own count of October 2026 MLS® sales.
Is it a buyer’s or a seller’s market for Toronto condos?
The City of Toronto had 5,251 active condo listings against 949 sales in October 2026, which is 5.5 months of inventory. Zero to two months is a seller’s market, three to five balanced and six or more a buyer’s market (whole months: 2.9 is still a seller’s market).
How long does it take to sell a condo in Toronto?
Toronto condos that sold in October 2026 took an average of 36 days and sold for 97% of the asking price, according to TRREB. By our count, one-bedrooms with parking averaged 35 days and two-bedrooms with parking 36 days.
What do condos cost in downtown Toronto?
In C01 (downtown, King West and Liberty Village), one-bedroom condos with parking averaged $613,459 (74 sales) and two-bedrooms with parking $949,289 (67 sales). In C08 (St. Lawrence, Church-Wellesley and Cabbagetown), one-bedroom condos with parking averaged $555,562 (24 sales) and two-bedrooms with parking $795,909 (33 sales). Figures are the Michael Ouzas Real Estate Team’s own count of October 2026 MLS® sales.
Where do these numbers come from?
Prices, sales, listings and days on market come from the Toronto Regional Real Estate Board (TRREB) Market Watch report for October 2026. The bedroom and parking breakdowns are the Michael Ouzas Real Estate Team’s own count of October 2026 MLS® sales, the same numbers Michael Ouzas uses in his monthly Toronto condo market video. The page is published by the Michael Ouzas Real Estate Team at Royal LePage Signature Realty and updated every month.
Statistics on this page are drawn from Toronto Regional Real Estate Board (TRREB) Market Watch reports (January 2024 through October 2026) and are deemed reliable but not guaranteed. Figures are district-level MLS® averages and medians; individual streets and property types vary. This page is for informational purposes only and is not intended to solicit properties currently listed for sale or buyers under contract. Updated monthly when TRREB releases new data. Last updated with October 2026 data. Michael Ouzas Real Estate Team · Royal LePage Signature Realty, Brokerage.