Toronto Rental Stats · Michael Ouzas Real Estate Team · Updated Quarterly
Toronto Condo Rent Stats: Average Rent by Bedroom and District
In Q2 2026, the average one-bedroom condo in the City of Toronto leased for $2,316 a month and the average two-bedroom for $3,154, according to TRREB.
Average rents for condo apartments leased through TRREB’s MLS® System in the City of Toronto, by bedroom count and by district, with 14 quarters of history. Vacancy figures are from CMHC, and GTHA supply figures from Urbanation. If you own a condo you rent out, this is the market your unit is priced against. If you’re looking to rent, it shows what each part of the city costs.
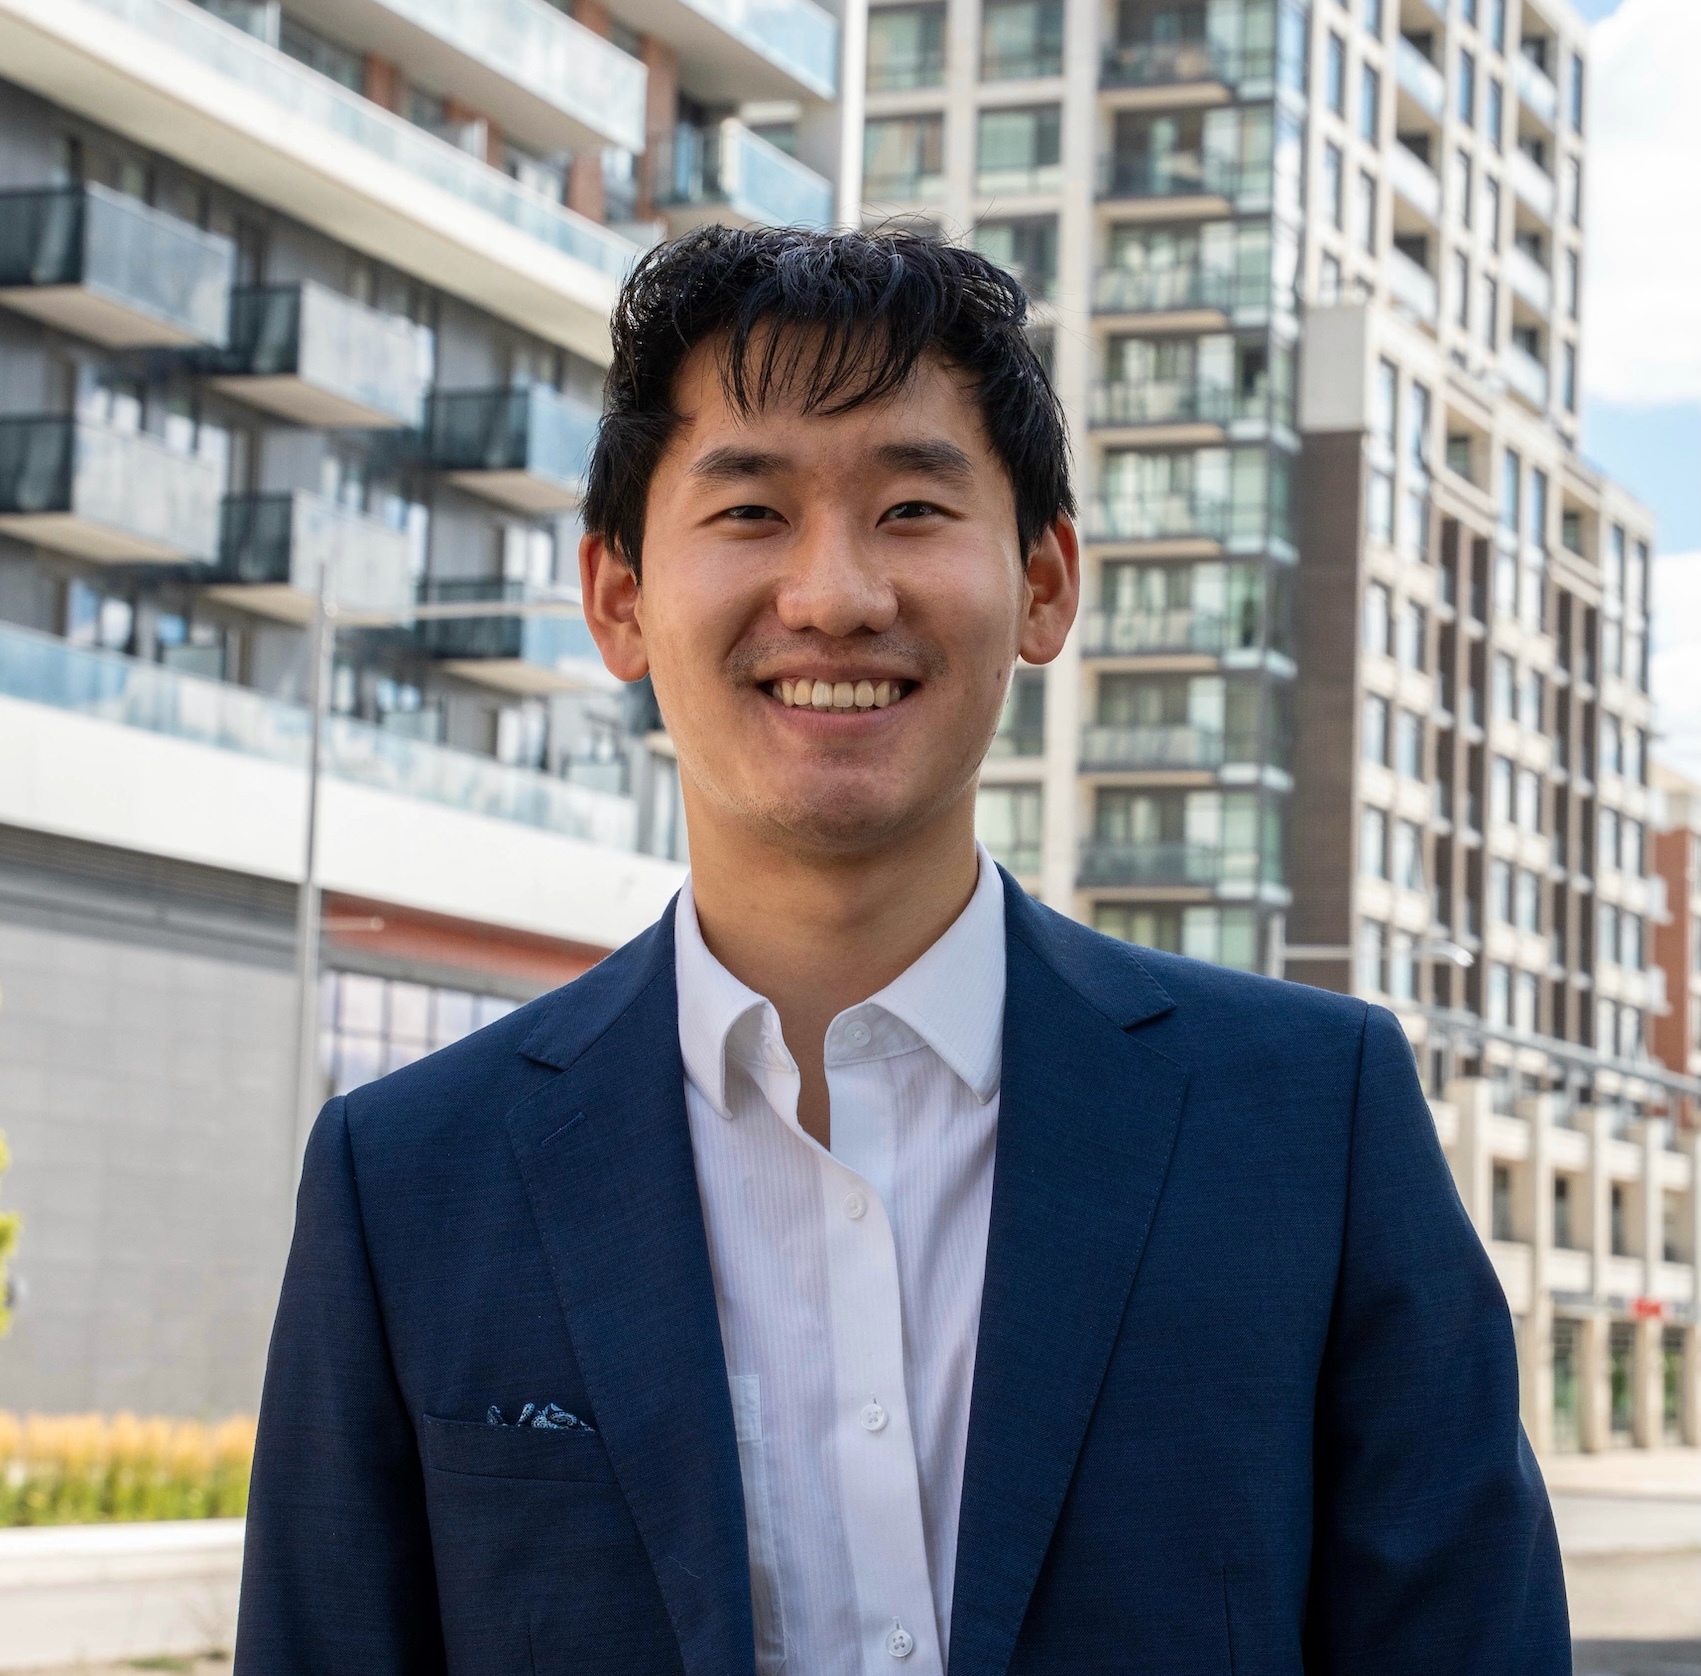 Prepared by Sheng Cau, REALTOR® and downtown Toronto leasing specialist with the Michael Ouzas Real Estate Team, Royal LePage Signature Realty. Rent out your condo or find a rental.
Average Condo Rent by Bedroom Count
A one-bedroom condo in the City of Toronto leased for an average of $2,316 in Q2 2026, down 2.2% from Q2 2025 and down 13.4% from the peak of $2,674 in Q3 2023. A two-bedroom averaged $3,154, down 1.7% from a year earlier and down 12.5% from the peak of $3,603 in Q3 2023. Three-bedrooms averaged $3,882.
City of Toronto condo apartments, average lease rate by quarter. Source: TRREB Rental Market Report, Q1 2023 to Q2 2026.
Leasing is seasonal: volume peaks in the second and third quarters and drops in the fourth and first, so every comparison on this page is against the same quarter a year earlier.
Vacancy and Supply
CMHC’s October 2025 survey found 0.9% of rented condos in the City of Toronto vacant, up from 0.8% a year earlier, with 42.3% of all condo apartments in the city (162,819 units) rented out. On TRREB’s MLS® System, 15,388 of the 20,051 condos listed for lease in Q2 2026 were leased.
Across the Greater Toronto Hamilton Area, Urbanation counted 18,923 condo lease transactions in Q2 2026, the highest second quarter in its 10-year record, against 5,366 active rental listings. That is 0.9 months of supply, below the 10-year average of 1.0. Average rent was $3.74 per square foot, down 1.3% from a year earlier.
GTHA condo apartment lease transactions, second quarter of each year. Source: Urbanation Inc., GTHA Condo Market Report Q2 2026.
Get a Free Rental Estimate for Your Condo
Tell me about the unit and I’ll send you what it should lease for, based on recent leases in your building and district. Submitting also unlocks the district table below.
Looking for a Condo to Rent?
Tell me what you’re looking for and I’ll send you condos that fit, then set up viewings with you. Submitting also unlocks the district table below.
Condo Rents by District, Q2 2026
Average lease rate for one- and two-bedroom condo apartments in every TRREB district in the City of Toronto, with the year-over-year (YoY) change from Q2 2025. Each average shows the number of leases it is based on. A change shows as n/a only where a quarter had no leases.
| District | 1-Bed Avg | 2-Bed Avg | Leased | 1-Bed YoY | 2-Bed YoY |
|---|---|---|---|---|---|
| Toronto West | $2,2431,261 leases | $2,916702 leases | 2,087 | -3.9% | -2.9% |
| W01High Park, Roncesvalles, Parkdale | $2,35588 leases | $3,12345 leases | 146 | +1.7% | +1.5% |
| W02Bloor West, Junction | $2,202241 leases | $2,942130 leases | 404 | -4.7% | -5.3% |
| W03Keelesdale, Corso Italia | $2,09912 leases | $2,52114 leases | 27 | -1.3% | -4.8% |
| W04Weston, Maple Leaf | $2,12682 leases | $2,53944 leases | 137 | -3.8% | -7.6% |
| W05Downsview, York University | $2,17191 leases | $2,66346 leases | 146 | -5.0% | -0.6% |
| W06Mimico, Humber Bay Shores | $2,419285 leases | $3,267151 leases | 446 | 0.0% | -0.2% |
| W07Stonegate-Queensway | $2,19923 leases | $2,72524 leases | 51 | -8.3% | -6.2% |
| W08Islington, Kingsway, Etobicoke Centre | $2,172415 leases | $2,828219 leases | 668 | -6.1% | -2.5% |
| W09Richview, Kingsview | $2,3002 leases | $2,7619 leases | 16 | n/a | -1.0% |
| W10Rexdale, Thistletown | $2,14222 leases | $2,58920 leases | 46 | -2.7% | -5.7% |
| Toronto Central | $2,3427,049 leases | $3,2563,820 leases | 12,243 | -1.6% | -0.7% |
| C01Downtown, King West, Liberty Village | $2,4752,575 leases | $3,4941,114 leases | 4,233 | +1.1% | +1.9% |
| C02Annex, Yorkville | $2,623280 leases | $5,181170 leases | 514 | +3.1% | +28.1% |
| C03Forest Hill, Humewood | $2,25899 leases | $3,54247 leases | 161 | -3.4% | +12.4% |
| C04Lawrence Park, Bedford Park | $2,33043 leases | $3,19626 leases | 75 | -0.4% | -1.4% |
| C06Bathurst Manor, Clanton Park | $2,13278 leases | $2,49670 leases | 158 | -2.7% | -5.8% |
| C07Willowdale West | $2,232193 leases | $2,902185 leases | 408 | -4.4% | -4.5% |
| C08St. Lawrence, Church-Wellesley, Cabbagetown | $2,2691,985 leases | $3,1221,080 leases | 3,535 | -0.8% | -0.2% |
| C09Rosedale, Moore Park | $2,42518 leases | $4,93124 leases | 49 | -14.1% | +10.9% |
| C10Davisville, Mount Pleasant | $2,224420 leases | $3,095268 leases | 773 | -3.7% | -0.8% |
| C11Leaside, Thorncliffe Park | $2,17859 leases | $2,77450 leases | 123 | +0.6% | -10.1% |
| C12York Mills, St. Andrew | $2,7598 leases | $4,12311 leases | 20 | -1.3% | +27.3% |
| C13Don Mills, Banbury | $2,077277 leases | $2,634176 leases | 470 | -9.5% | -15.7% |
| C14Willowdale East, Yonge and Sheppard | $2,273419 leases | $2,954290 leases | 738 | -4.8% | -2.3% |
| C15Bayview Village, Don Valley Village | $2,224595 leases | $2,840309 leases | 986 | -4.9% | -5.2% |
| Toronto East | $2,151537 leases | $2,652442 leases | 1,058 | -4.4% | -6.8% |
| E01Leslieville, Riverdale | $2,44983 leases | $3,08251 leases | 134 | -0.2% | -6.8% |
| E02The Beaches | $2,06943 leases | $2,91428 leases | 74 | -4.2% | -4.6% |
| E03Danforth, East York | $2,02413 leases | $2,8647 leases | 27 | -8.7% | +4.4% |
| E04Wexford, Dorset Park | $2,14236 leases | $2,42030 leases | 70 | +0.2% | -6.5% |
| E05L'Amoreaux, Steeles | $2,14240 leases | $2,66051 leases | 101 | -5.6% | -1.7% |
| E06Birch Cliff, Oakridge | $2,00633 leases | $2,67311 leases | 47 | -8.3% | -1.0% |
| E07Agincourt | $2,11973 leases | $2,56481 leases | 160 | -4.4% | -6.5% |
| E08Cliffcrest, Guildwood | $2,08511 leases | $2,57917 leases | 31 | -3.7% | -10.1% |
| E09Scarborough City Centre, Woburn | $2,134110 leases | $2,63399 leases | 234 | -5.8% | -4.5% |
| E10West Hill, Rouge | $2,11753 leases | $2,44938 leases | 104 | +13.8% | -2.0% |
| E11Malvern | $1,97942 leases | $2,42229 leases | 76 | -12.1% | -3.8% |
Free Guides for Landlords and Renters
How we find and qualify your tenant, the complete landlord listing services list, and the Ontario rules every landlord should know.
Get the free guide →
How renting a condo works, from your first search to picking up your keys, and the documents you need to apply.
Get the free guide →Toronto Condo Rent FAQ
What is the average rent for a condo in Toronto?
In Q2 2026, a one-bedroom condo apartment in the City of Toronto leased for an average of $2,316 a month, a two-bedroom for $3,154 and a three-bedroom for $3,882. Studios averaged $1,862. These averages come from 15,388 condo leases recorded on TRREB’s MLS® System that quarter.
Are condo rents in Toronto going up or down?
One-bedroom condo rents in the City of Toronto were down 2.2% in Q2 2026 compared with Q2 2025, and two-bedroom rents were down 1.7%. One-bedroom rents are down 13.4% from their peak of $2,674 in Q3 2023. Leasing is seasonal, so each quarter is compared with the same quarter a year earlier.
What is the condo vacancy rate in Toronto?
CMHC’s Rental Market Survey (October 2025) found 0.9% of rented condo apartments in the City of Toronto vacant, up from 0.8% a year earlier. 42.3% of condo apartments in the city (162,819 units) were rented out.
How much can I rent my condo for in Toronto?
It depends on the building, size, floor, exposure, parking and finishes. As a starting point, City of Toronto condos averaged $2,316 for a one-bedroom and $3,154 for a two-bedroom in Q2 2026, and the district table on this page breaks rents down by TRREB district. For a figure based on recent leases in your own building, request a free rental estimate from Sheng Cau of the Michael Ouzas Real Estate Team.
Where does this Toronto rent data come from?
Rents and lease counts come from the Toronto Regional Real Estate Board (TRREB) quarterly Rental Market Report, which covers apartments leased through TRREB’s MLS® System. Vacancy figures come from the Canada Mortgage and Housing Corporation (CMHC) Rental Market Survey, and GTHA lease and supply figures from Urbanation’s GTHA Condo Market Report. The page is updated every quarter when TRREB publishes a new report.
Who publishes Toronto Rental Stats?
Toronto Rental Stats (torontorentalstats.com) is published by Sheng Cau, a REALTOR® and downtown Toronto leasing specialist with the Michael Ouzas Real Estate Team at Royal LePage Signature Realty. Sheng and the team have completed hundreds of leases, working with tenants looking for condos to rent and with owners leasing out their condos, mainly in downtown Toronto.
Rent and lease figures are drawn from the Toronto Regional Real Estate Board (TRREB) Rental Market Report (Q1 2023 to Q2 2026), covering apartments leased through TRREB’s MLS® System; they are deemed reliable but not guaranteed. GTHA figures: Urbanation Inc., GTHA Condo Market Report Q2 2026, prepared for Royal LePage Signature Realty. Source: Canada Mortgage and Housing Corporation (CMHC), Rental Market Survey, October 2025. Adapted from CMHC; this does not constitute an endorsement by CMHC. Individual buildings and units vary. This page is for informational purposes only and is not intended to solicit properties currently listed or clients under contract. Updated quarterly. Last updated with Q2 2026 data. Michael Ouzas Real Estate Team · Royal LePage Signature Realty, Brokerage.