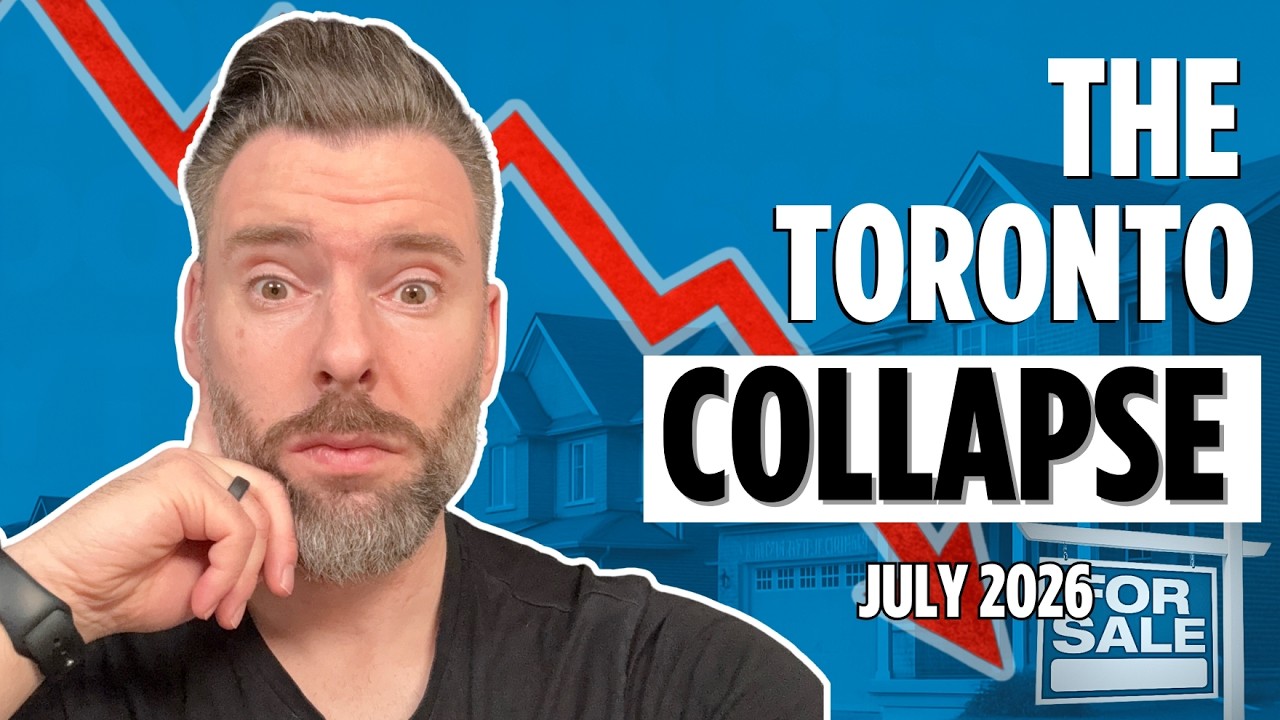
The July 2026 numbers from the Toronto Regional Real Estate Board (TRREB) show a market holding its ground on sales while inventory keeps shrinking. GTA sales came in at roughly 6,000, about 50 fewer than last July, and listings were down 12% year-over-year. The average price slipped to just over $1 million, the lowest July figure in years.
Beneath the headline figures, Toronto condo sales are up while smaller units sit, semi-detached and townhouse inventory is thin enough to produce multiple offers, and the 905 is down in sales across almost every property type.
The GTA Picture
The average price across the GTA landed just over $1 million, roughly $1,003,000 to $1,004,000. That is the lowest July price in years, and below July 2022. Condo sales were flat from last year, but the average condo price was down significantly, which pulls the overall average down with it.
Listings were down 12% from July of last year. Total sales were flat at around 6,000, ahead of 2024 and only about 50 behind last July, which was one of the best Julys in years even though 2025 was one of the slowest years on record. Months of inventory, which divides active listings by sales, sits at 4.35.
The City of Toronto
Condo sales in Toronto proper were up 3% from last year, the strongest single month for condo sales since 2023. The average condo price was $672,000, down only 1.6% year-over-year. The caveat is that studios and one-bedrooms, especially without parking, are not selling as well, and when those lower-priced units start to trade they could pull the average down further.
The average price across the city was down 3% from last year. Active listings were down 13.5% to 9,000, and that figure includes condos, which leaves very little inventory in the freehold space.
Inventory, Rates and the Fall Ahead
Last July the GTA sat at about five months of inventory and stayed there until October. This year it has not touched five since January, and July came in at 4.3 months, in line with March and April. Properties are taking 32 days to sell on average, with 6,000 sales out of 26,000 listings. That listing count is lower than July through October of 2025. If active listings drop into the 20,000 range while sales hold, months of inventory will tighten quickly.
The Bank of Canada held its rate, rates have been flat for about a year, and fixed rates are sitting around 4%.
Last year’s fall market was very short. Properties came out in September, and within a few weeks some of the city’s best pockets had almost no inventory until February. That four-month gap is why February was so strong for semis and detached. A slow August is expected, so anyone planning a fall move should get organized now.
How July 2026 Compares to Past Julys
July 2021 was the start of the price run-up. Active listings then were 9,000, about a third of today’s 26,000, against 9,800 sales, which kept months of inventory below one. Properties sold in half the time and at 104% of asking. The average price was $1,075,000 in July 2021 and climbed for seven to eight consecutive months to the $1.3 million peak in February and March 2022, an increase of about 30%. By July 2022 the average had fallen to about $1.2 million on 5,000 sales and 15,000 listings, and last July had 29,000 listings.
Year-to-date, 2026 has seen 102,000 listings, compared with 120,000 last year, 105,000 in 2024, 87,000 in 2023, 113,000 in 2022 and 120,000 in 2021. Sales year-to-date are 37,000, only about 200 ahead of last year, versus 40,000 in 2024 and 2023, 55,000 in 2022 and 83,000 in 2021. The average price year-to-date is $1,032,000.
416 Versus 905
July sales by property type:
- Detached: 700 in the 416, 2,100 in the 905
- Semi-detached: 233 in the 416, 324 in the 905
- Townhouses: 250 in the 416, 750 in the 905
- Condos: 1,054 in the 416, 510 in the 905
In the 905, every property type except detached was down in sales year-over-year. In Toronto proper, detached sales were up, semi-detached were down 7% because so few have been for sale, townhouses were up 9% and condos were up 3.3%. Pricing was down for every property type in every area. Toronto detached averaged about $1.55 million, down roughly 1.5%. Semi-detached were down almost 10%, although in the hottest pockets some sales this year have topped 2022 and 2023 levels.
Across the board, sales were down 1% year-over-year, listings were down almost 18%, and the average price was down about 4.5%. Listing days on market rose about 7%, only two extra days, while property days on market, which counts relists, rose 12%.
Toronto by Property Type
Detached sits at 3.77 months of inventory, a balanced market. Prices are down almost $100,000 from June, which is seasonal. There were 700 sales in July, compared with 600 in November and 290 in January, and 2,600 active listings.
Semi-detached is at two months of inventory, a seller’s market. There were 459 active listings in July and 233 of them sold. Townhouses and row houses recorded 95 sales against 225 active listings, or 2.37 months of inventory, with pricing around $1,050,000, down almost $200,000 from the peak this year. For a city the size of Toronto, 225 listings around the $1.1 million mark is very little product, and multiple offers have been common lately.
Condo sales have held above 1,000 per month throughout the year, helped by the new HST rebates. Active listings sit at 5,228, so roughly one in five is selling. The market is balanced but segmented. The average price was about $673,000 in July, close to the $674,000 high in May, and effectively flat for the last four or five months.
Demand is steady, supply is shrinking and results depend on the pocket. If you are weighing a fall move, book a conversation with the team to walk through the numbers for your property.

Former pro hockey player and West Toronto's most data-driven agent. Michael publishes weekly market analysis on this blog and YouTube.