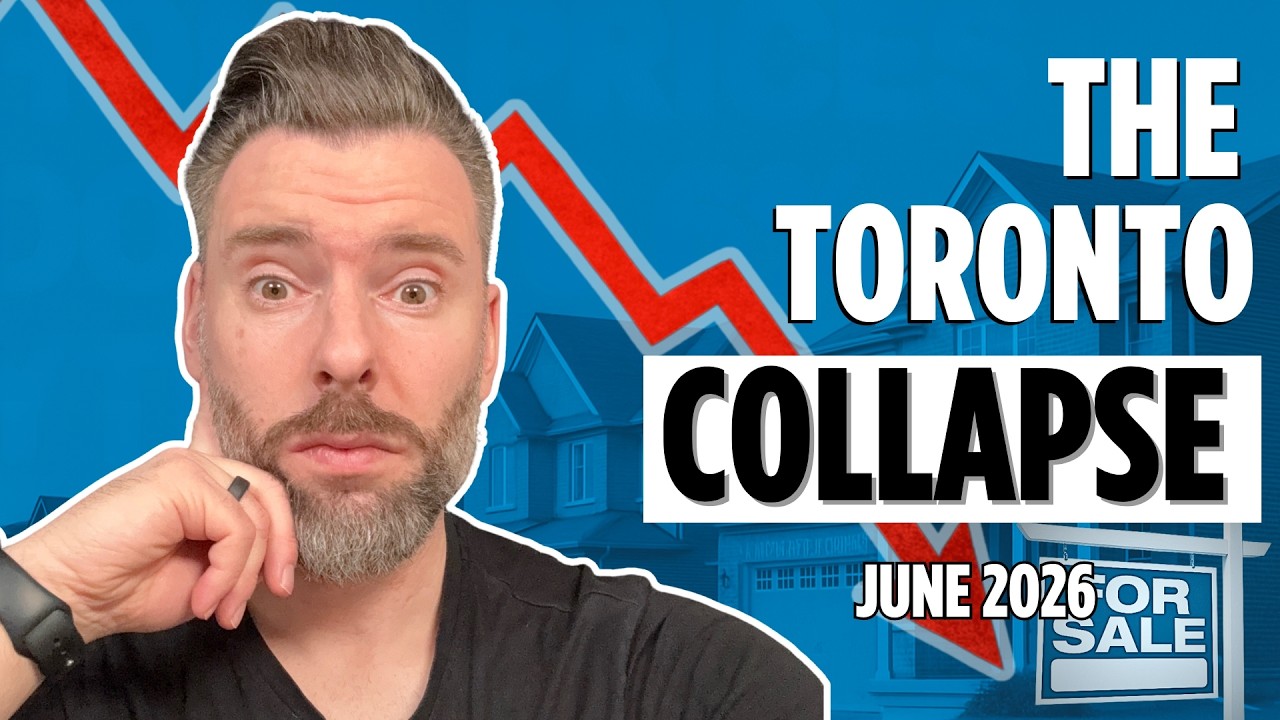
June 2026 may have been one of the most interesting months of data Toronto real estate has produced in years. Sales are up and prices are down, but the number that matters most is months of inventory. At 4.04 months across the GTA and 4 months in the city of Toronto, inventory is the tightest it has been in the last 12 months, and that is the figure that tends to move prices next.
Months of Inventory Is the Number to Watch
Months of inventory is active listings divided by sales. Five to six months is a buyer’s market, three to five is balanced, and the twos or below is a seller’s market. The GTA came in at 4.04 months in June, the lowest reading in quite some time. Put simply, one in four properties is selling. When that number keeps contracting and demand is still there, prices generally follow.
The GTA average price is down 4% from last year and about $130,000 from 2023. Active listings sit at 27,000, down about 13%, while sales are up. The caveat is that last June was one of the slowest real estate months in history. The better comparison is that June 2026 also passed 2024, a reasonably good spring, while June 2023 still had almost 1,000 more sales.
Toronto: Fewer Listings, Competitive Low-Rise
Toronto is at 4 months of inventory, with the average price down about 5% from last year and about $80,000 from 2023, a smaller gap than the GTA’s. Active listings are down 14%, and most of what remains is condos. If you want a semi-detached or detached house in the best areas, one might come up every week or every couple of weeks, and it is competitive. Sales are up 6% from last year and not far off 2023 levels.
Sales have grown month after month, basically every month this year, which did not happen at any point last year. Active listings are well below last year’s peak of 31,000, partly because sellers hear the market is slow and never list.
Last June Was the High Point of 2025
June of last year was the highest price point of the year. From June through to February values came down almost every month, with a small bump in the fall, and June finished about $50,000 above the rest. We have not yet returned to that June 2025 figure of 1.101 million. If sales keep rising and inventory keeps tightening, the market may start pushing toward it, though generally not during the summer.
Four Years Since the Peak
The peak was 1.3 million in March 2022. Today the average sits around 1.05 million, down roughly $250,000 or about 25%. What rarely gets discussed is that 70% or 80% of that decline happened between March and June or July of 2022.
Rates explain the speed. The first increase was 0.25, then 0.5, then a 1% jumbo increase, then another large one. Within six months the overnight rate went from 1.5 to 4.5, the fastest tightening cycle in modern Canadian history. When the Bank of Canada held in 2023, prices rose in an active spring, then rates went up again and prices fell back to roughly where they are today. Rates came down, activity picked up, and tariff news slowed things again. The last few months have brought stability: fixed rates around 4 to 4.5%, variable a little less, and a balanced market overall.
June Against the Last Few Junes
Total sales came in at 6,700, roughly in line with June 2022, about half of 2021, and well short of the almost 7,900 sales in June 2023. May 2021 had almost 12,500 sales. Active listings were 10,000 in both May and June of 2021, about a third of today’s inventory. Average time on market is about a month, and the list-to-sale ratio is 98%. In 2021 properties sold about 5% over asking, 2023 was almost the same, and 2022 was flat.
That 98% deserves a caveat. In Toronto a price change usually means cancelling and re-listing, which resets days on market. If the property then sells within 2% of the new price, it registers as 98% of list, even if it started $100,000, $200,000 or $300,000 higher.
Another pattern: a property sits for 30 days with no activity, one buyer makes an offer, and suddenly there are three. If a property checks the boxes and the pricing makes sense, act sooner rather than later.
Year to Date and by Property Type
New listings year to date stand at 88,000, the second lowest of recent years after 2023 and far below 2021, 2022, 2024 and 2025. Sales year to date are 31,000, up about 9% on a weak 2025. The year-to-date average price of $1,040,000 is skewed by a slow start to the year.
- Condos: sales up 14% year over year, prices down about 9%. Our rental listings have drawn multiple offers in the first week, which narrows the rent-versus-buy gap.
- 905 overall: sales up 12%, prices down about 2%. On a million-dollar property that is $20,000.
- Detached: Toronto prices up 0.3% at an average of 1.65 million. The 905 average is 1.275 million.
- Semi-detached: the hottest product in the city, with sales down about 3% because so few come to market. In the 905, sales up 8.4% and prices down about 7%.
- Townhouses: sales flat in the 416 and up 6% in the 905. Prices up in Toronto, down in the 905.
Toronto’s numbers form a clean property ladder, with roughly a $300,000 jump from condo to townhouse to semi to detached. In the 905, condos lag townhouses, townhouses run closer to semis, and the step up to detached is much larger.
June closes the spring market. Whether these prices hold through the summer depends on sales climbing while listings stay thin. If you are weighing a move in the next 6 to 12 months, book a conversation with the team and we will run the numbers for your pocket.

Former pro hockey player and West Toronto's most data-driven agent. Michael publishes weekly market analysis on this blog and YouTube.