Toronto West ran close to a normal August in 2026, and its best pockets stayed competitive. Across TRREB’s Toronto West region (districts W01 to W10), 460 homes sold, 6.7% fewer than in August 2025, while active listings fell 3.8% to 2,246. For the full city picture, see the August market report.
Toronto West in August 2026
The average sale price across the region was $955,789, against $957,474 a year earlier. Homes took an average of 35 days to sell, up from 31 in July, and sold at 98% of their asking price (97% in August 2025). Active listings divided by sales comes to about 4.9 months of inventory, the high end of a balanced market.
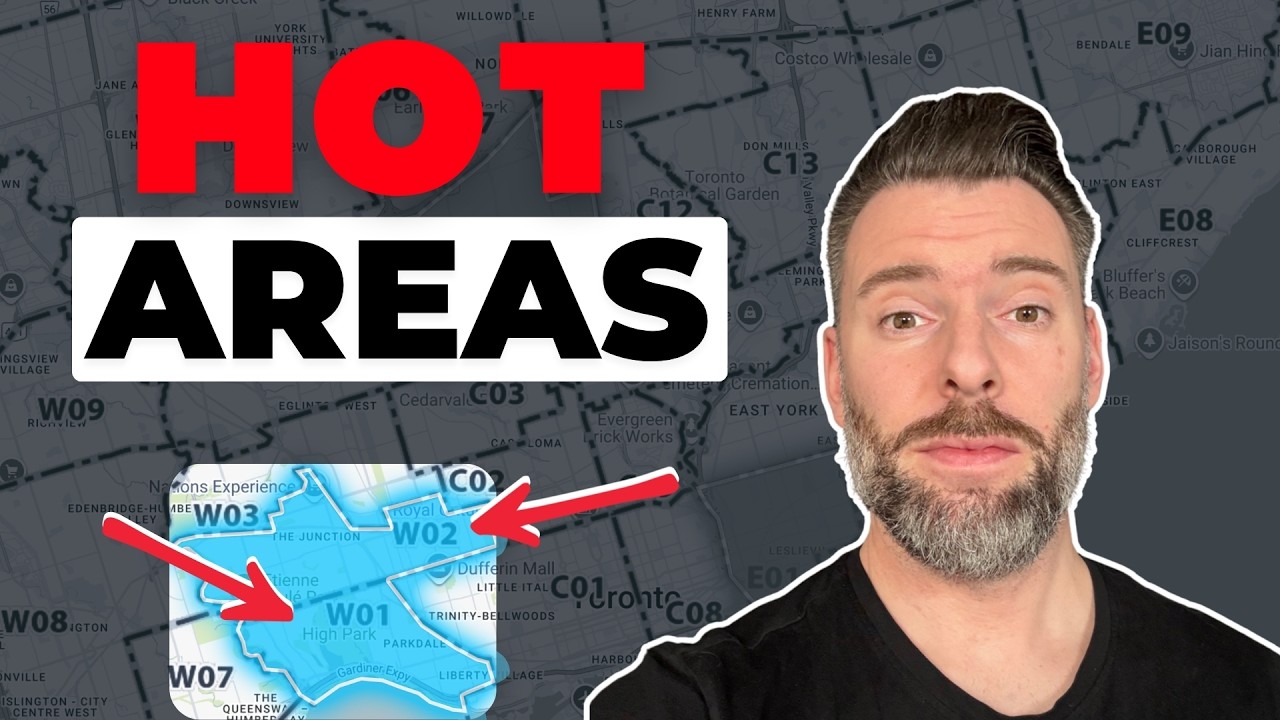
Those region-wide averages include W04, W05, W09 and W10, where prices are lower and inventory is higher. The districts closer to the core, especially W01, W02 and W07, run hotter than the region numbers suggest.
W01: High Park, Swansea, Roncesvalles and Parkdale
32 of 142 active listings sold in August. Detached houses: 5 sales from 22 active listings, an average price of $1,925,520, 24 days on market and about 4.4 months of inventory. At least one Roncesvalles detached house sold for more than $600,000 over its asking price. Semi-detached: 3 sales from 8 active listings, average $1,335,107. Condo apartments make up most of the inventory: 19 sold from 99 active listings, at an average of $640,800, and condo listings in W01 are taking longer to sell than houses.
W02: Bloor West Village, High Park North and the Junction
41 of 140 active listings sold. Detached: 9 sales from 35 active listings, average $1,277,333, about 3.9 months of inventory. Semi-detached was the strongest segment: 10 sales from 23 active listings, average $1,148,725, about 2.3 months of inventory, which is seller’s market territory. Condos: 12 sales from 64 active listings, average $567,584. W02 splits at the rail tracks in the Junction: west of the tracks the houses and lots are generally bigger, east of them tighter, and the two sides price differently.
W07: Stonegate-Queensway and Sunnylea
Only 9 of 70 active listings sold. Detached: 7 sales from 43 active listings, about 6.1 months of inventory, at an average of $2,160,676, the highest detached average in the West End this month. None of the 23 active condo apartments sold. Most detached activity sits between $1.5 million and $2 million; below $1.5 million a house usually needs work, and many W07 houses list between $2.5 million and $3 million.
Average prices across six West End districts
Detached, August 2026: W07 $2,160,676; W08 $1,962,291; W01 $1,925,520; W06 $1,371,688; W02 $1,277,333; W03 $953,767.
Semi-detached: W01 $1,335,107; W02 $1,148,725; W06 $1,142,379 (4 sales); W03 $1,086,200; W08 $883,750 (2 sales). W07 had no semi-detached sales.
Condo apartments: W06 $642,661; W01 $640,800; W08 $607,000; W03 $600,000 (2 sales); W02 $567,584. W07 had no condo sales. With few sales in a month, one or two high-priced units move these averages a lot, so medians are often the steadier number.
What to expect this fall
New listings picked up in the first week after Labour Day, the most inventory the West End had seen in about three months. Last year the same window lasted roughly from Labour Day to Thanksgiving before inventory thinned again through the winter, and a similar pattern is likely this year.
What this means for buyers and sellers
Buyers: the fall window is the best selection you are likely to see before spring, and turnkey houses in W01, W02 and W07 still draw multiple offers, so be ready before the right one lists. Sellers: a well-prepared house priced for 2026 is selling quickly in the core West End pockets, while condos and outer-district listings need sharper pricing.
The district numbers are updated every month on the Toronto West market stats page. To talk through a move, book a call with Michael.

Former pro hockey player and West Toronto's most data-driven agent. Michael publishes weekly market analysis on this blog and YouTube.