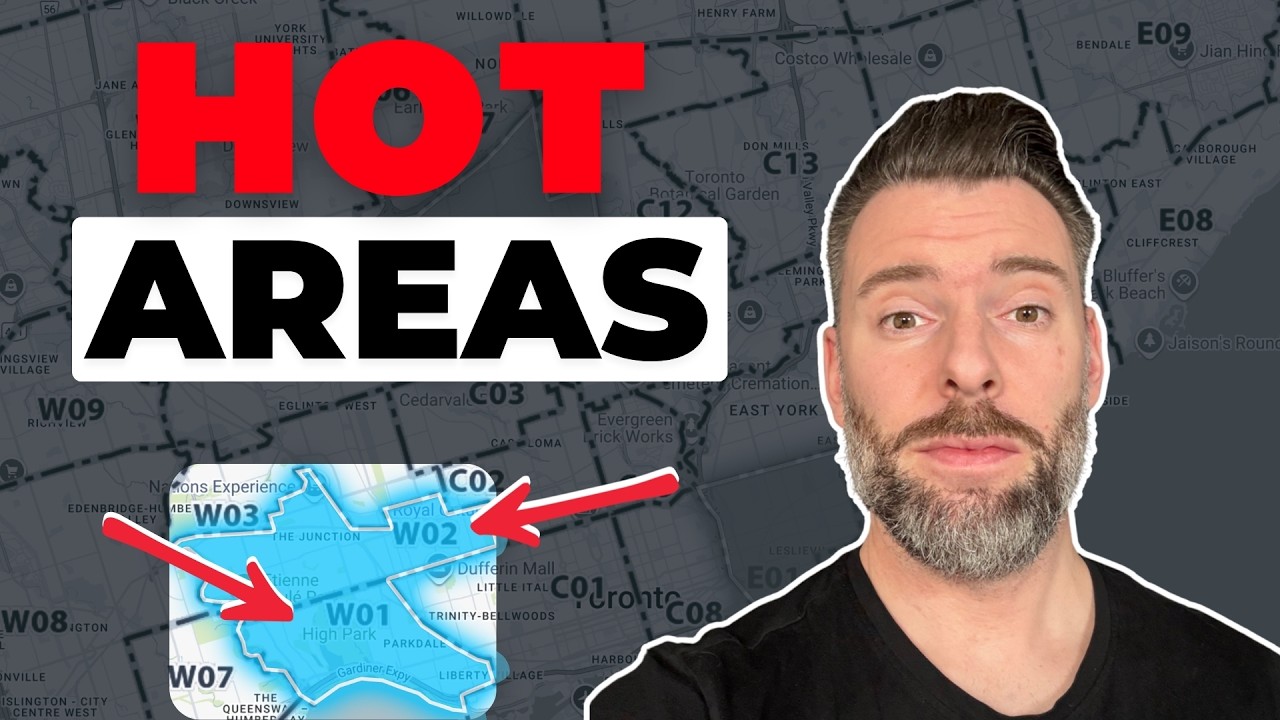
Toronto West has outperformed the rest of the city all year, and September 2026 kept that going for houses. Across the ten west districts, W01 to W10, 532 homes sold, down 4.8% from 559 a year earlier, at an average price of $985,920, down 5.4%. Active listings were 2,543, down 2.2%. Homes sold at 98.7% of their last asking price. For sell rates by neighbourhood, see Toronto West End Sell Rates, September 2026.
Toronto West in September 2026
2,543 active listings against 532 sales is 4.8 months of inventory, computed as active listings divided by sales. That is a balanced market on paper. The average hides how different the property types are: detached and semi-detached houses in the core west districts sold in two to three months of inventory, while condos in W01 and W02 sat at seven to nine. Selling at close to 99% of asking on average also hides the houses that sold well above it.
W01: High Park, Swansea, Roncesvalles and Parkdale
W01 had 34 sales from 167 active listings. Detached: 11 sales from 36 active listings, about 3 months of inventory, at an average of $1,760,545, on the edge between a seller’s and a balanced market. Semis: 5 sales from 13 active listings, 2.6 months of inventory, at an average of $1,573,400, up from $1,335,107 in August. Condos were slow: 12 sales from 111 active listings, 9.3 months of inventory.
W02: Bloor West Village, High Park North, the Junction and Baby Point
W02 had 60 sales from 188 active listings. Detached houses are the hottest segment in the west end: 25 sales from 53 active listings, about 2 months of inventory, at an average of $1,771,180. Semis: 14 sales from 31 active listings, also about 2 months, at an average of $1,214,982. A buyer looking for a semi or a detached house here should expect competition, whatever the headlines say about a slow market. Condos were slower, with 12 sales from 85 active listings. Many W02 condo sellers are moving up into their first house.
W07: Stonegate and Sunnylea
W07 sits just west of the Humber River, with access to the highways, the subway and Bloor, and generally larger houses. It had 23 sales from 88 active listings, about one in four. Detached: 17 sales from 50 active listings, about 3 months of inventory, at an average of $1,884,324. The area has few semis and only a handful of new condo buildings. For a condo west of the city, W06 near the water has more choice.
Where prices sit across the west end
For detached houses, W08 (the Kingsway, Islington and Markland Wood) averaged $1,901,530 and W07 $1,884,324. W02 and W01 came in at $1,771,180 and $1,760,545. W06 was lower at $1,279,857, where a typical purchase is a bungalow, and W03 lower still at $831,263. For semis, W01 led at $1,573,400, followed by W02 at $1,214,982; W06, W07 and W08 have few semis. W02 prices differ east and west of Keele and the rail tracks.
For condos, W01 led at $743,583, mostly lofts and buildings around Roncesvalles and Sorauren. W02 followed at $668,908, helped by subway access, and W06 at $640,225, mostly near Park Lawn, where transit to downtown is by streetcar or GO train.
What this means for buyers and sellers
Buyers: houses in W01, W02 and W07 are competitive, and well-presented ones are selling above asking. Sellers: a house priced to the 2026 market in these districts has a strong buyer pool, and condo sellers should price to the sales that closed. Every west district, updated monthly: Toronto West market stats. To talk through your plans, book a call with Michael.

Former pro hockey player and West Toronto's most data-driven agent. Michael publishes weekly market analysis on this blog and YouTube.