Bloor West Village Market Stats · Sold Prices by Pocket · Updated November 8, 2026
What Are Homes Selling for in Bloor West Village?
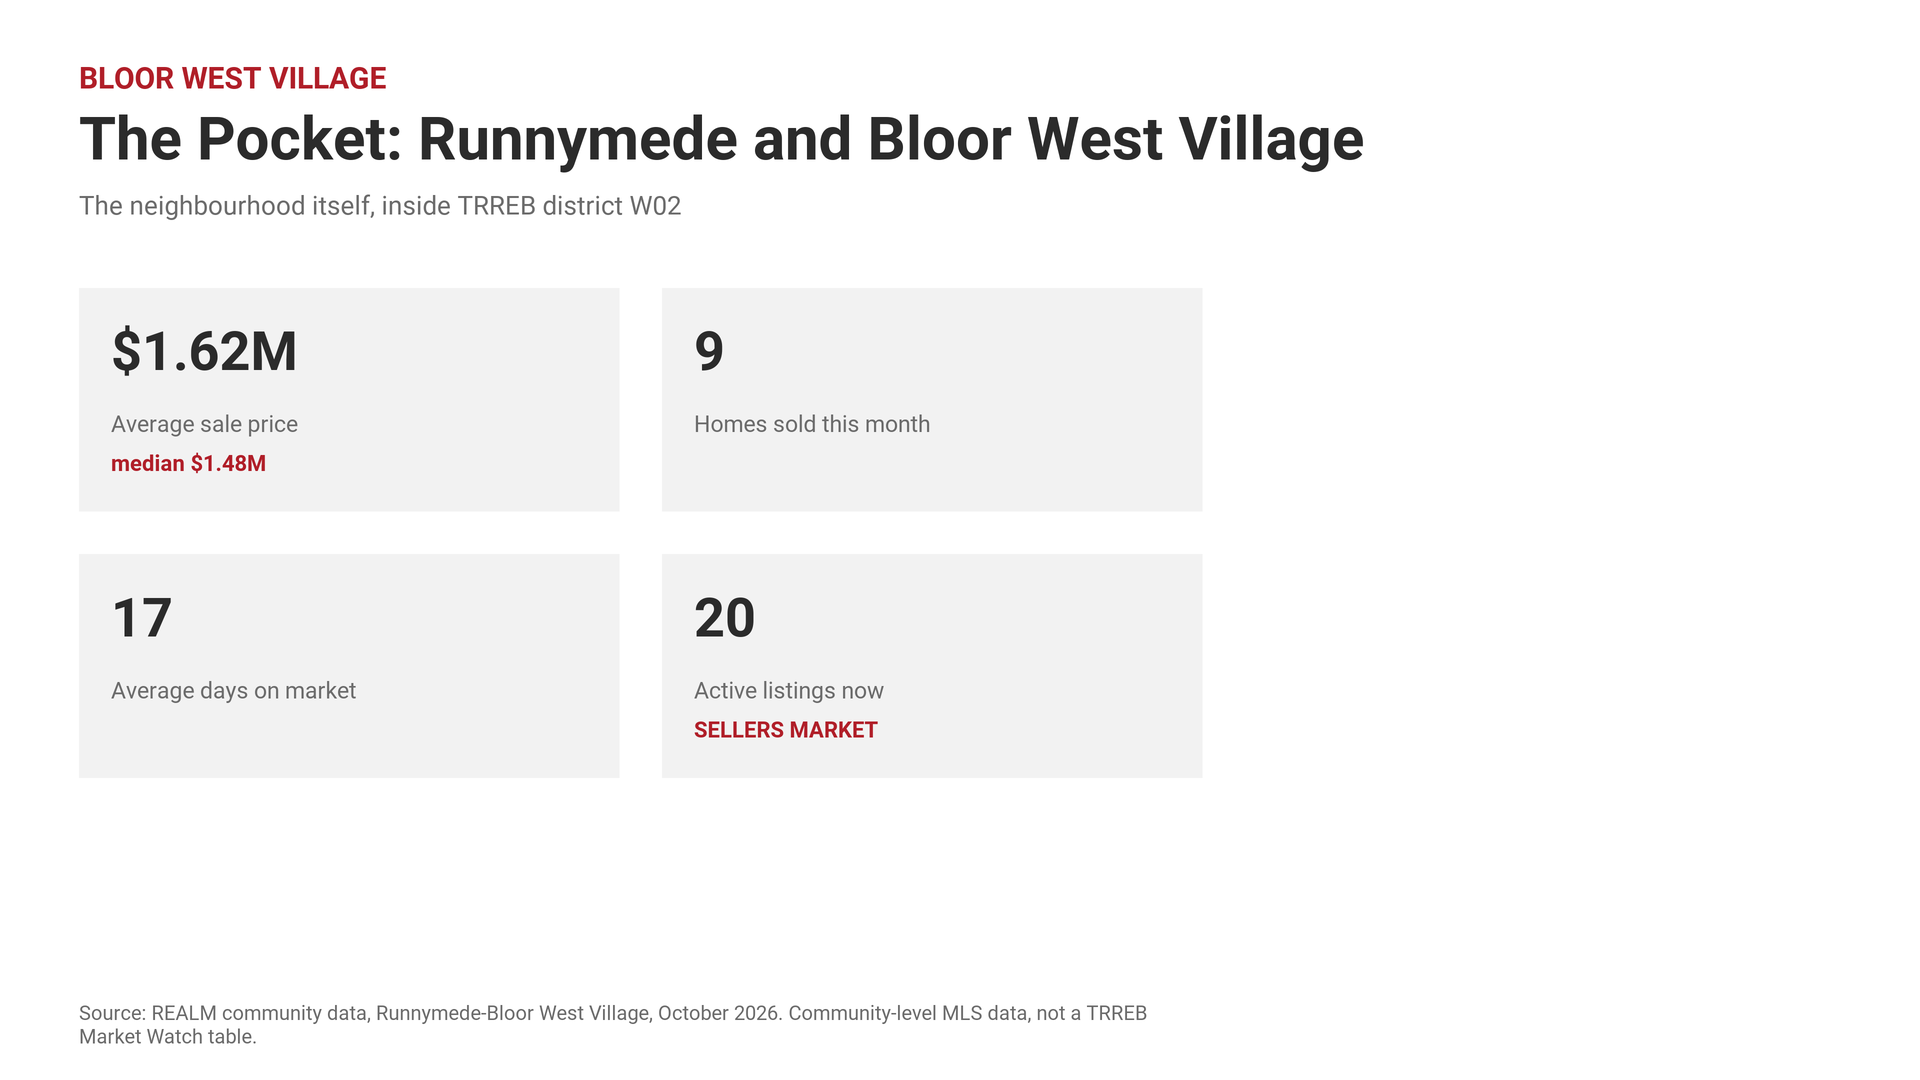
Every MLS® home sale in Bloor West Village from January 1 to November 4, 2026, pocket by pocket. Bloor West Village is in the TRREB community of Runnymede-Bloor West Village, in district W02, with Lambton Baby Point, Junction Area, High Park North and Dovercourt-Wallace Emerson-Junction. Compiled and reviewed by the Michael Ouzas Real Estate Team, Royal LePage Signature Realty. Red Diamond, National Top 2% (2025) | $40M+ closed, 2025 and 2026 | 200+ transactions.
How Are Homes Selling in Bloor West Village Right Now?
78% of semis sold.
49% of detached houses.
Median sold price, south and north of Annette Street, January 1 to November 4, 2026
| Type | South | North |
|---|---|---|
| Detached houses | $1,764,500 30 sales | $1,285,000 10 sales |
| Semis | $1,491,500 10 sales | $1,202,500 11 sales |
Thinking of buying in Bloor West?Thinking of selling in Bloor West?See homes for sale in Bloor West
This week’s picks: our top 10 homes for sale in Bloor West Village, High Park and Roncesvalles, at any budget, with why we like each one.
How Is Each Home Type Selling?
Share of new listings that sold (the sell rate), November 2025 to October 2026. Seller’s market, 60% and up Balanced, 40 to 59% Buyer’s market, under 40%
A new listing can be the same home listed more than once, so the share of homes that sold is higher. Source: TRREB MLS® data. See every neighbourhood on the map.
Bloor West Village, Pocket by Pocket
Every house and condo sale in W02 from January 1, 2026 to November 4, 2026, 608 in all, grouped by pocket. Price per square foot uses the above-grade size on the listing; the basement is not included. “Of asking” is the average sale price as a share of the asking price. “The same house” holds above-grade size, bathrooms, lot width and parking equal, and leaves out homes that front a boundary street.
W02: Bloor West Village, Baby Point, the Junction and High Park North
The Annette Line
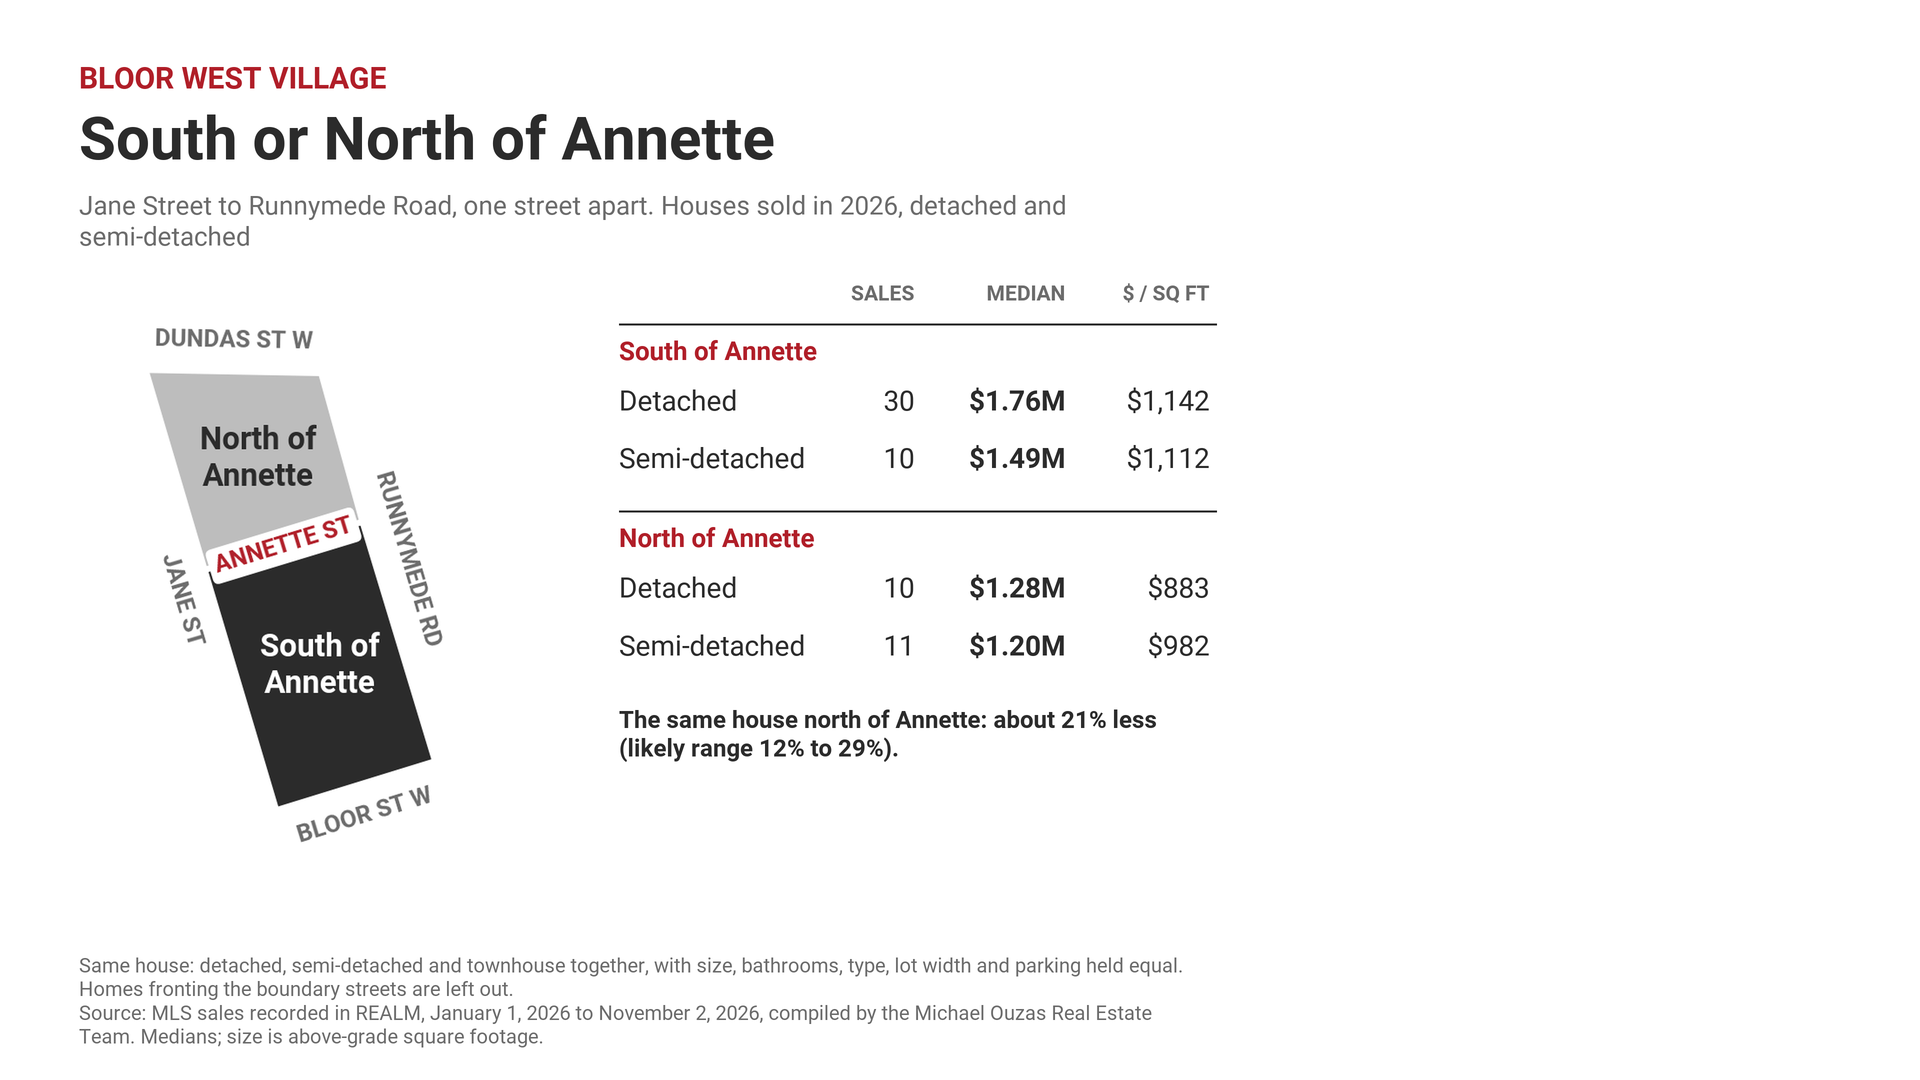
Between Jane Street and Runnymede Road, Annette Street divides the pocket. South of Annette runs down to Bloor; north of Annette runs up to Dundas. These are the house sales on each side in 2026.
Median sale price by type: Detached: $1,764,500 south of Annette (30 sales), $1,285,000 north of Annette (10 sales). Semi-detached: $1,491,500 south of Annette (10 sales), $1,202,500 north of Annette (11 sales).
Same House, Different Pocket in W02
What the same house sells for in each pocket against W02 as a whole. Houses only: detached, semi-detached and townhouses.
Likely ranges: High Park North +7% to +18%; Lambton Baby Point -2% to +11%; Runnymede-Bloor West Village +0% to +8%; Junction Area -7% to +4%; Dovercourt-Wallace Emerson-Junction -10% to -5%. A range that crosses zero means the difference is not clear from this year’s sales.
Detached houses in W02
| Sales | Median price | Per sq ft | Of asking | Sold over asking | Share sold | |
|---|---|---|---|---|---|---|
| All of W02 | 200 | $1,628,000 | $1,031 | 104% | 53% | Balanced 53% |
| High Park North | 40 | $1,775,000 | $1,046 | 104% | 55% | Balanced 53% |
| Lambton Baby Point | 42 | $1,690,000 | $1,128 | 100% | 36% | Seller’s 68% |
| Junction Area | 11 | $1,650,000 | $898 | 108% | 64% | Buyer’s 34% |
| Runnymede-Bloor West Village | 57 | $1,601,000 | $1,065 | 107% | 65% | Balanced 49% |
| Dovercourt-Wallace Emerson-Junction | 50 | $1,355,220 | $868 | 104% | 50% | Balanced 44% |
Semi-detached houses in W02
| Sales | Median price | Per sq ft | Of asking | Sold over asking | Share sold | |
|---|---|---|---|---|---|---|
| All of W02 | 168 | $1,255,000 | $884 | 108% | 59% | Balanced 59% |
| High Park North | 21 | $1,601,000 | $1,011 | 116% | 76% | Seller’s 82% |
| Runnymede-Bloor West Village | 31 | $1,240,000 | $1,046 | 108% | 65% | Seller’s 78% |
| Junction Area | 32 | $1,227,500 | $846 | 106% | 53% | Balanced 48% |
| Dovercourt-Wallace Emerson-Junction | 76 | $1,200,000 | $804 | 106% | 55% | Balanced 54% |
| Lambton Baby Point | 8 | $1,027,500 | $914 | 102% | 50% | Seller’s 62% |
Condo apartments in W02
| Sales | Median price | Per sq ft | Of asking | Sold over asking | Share sold | |
|---|---|---|---|---|---|---|
| All of W02 | 142 | $614,001 | $814 | 98% | 16% | Buyer’s 35% |
| High Park North | 46 | $762,500 | $952 | 99% | 26% | Balanced 42% |
| Junction Area | 35 | $591,888 | $768 | 98% | 9% | Buyer’s 31% |
| Dovercourt-Wallace Emerson-Junction | 61 | $463,500 | $743 | 97% | 13% | Buyer’s 31% |
Source: TRREB MLS® sales, January 1, 2026 to November 4, 2026, compiled by the Michael Ouzas Real Estate Team. These figures describe the market, not any one home.
Toronto W02, Street by Street
The main streets that run through each neighbourhood, and what sold on either side of them in 2026. Where the same home sells for clearly more on one side, the gap is shown; where it does not, it says so.
The Junction: South of Dundas and North of Dundas
Dundas Street West runs through Junction Area. These are the house sales on each side in 2026.
Baby Point: South of St John’s Road and North of St John’s Road
St John’s Road runs through Lambton Baby Point. These are the house sales on each side in 2026.
Dovercourt-Wallace Emerson: South of Dupont and North of Dupont
Dupont Street runs through Dovercourt-Wallace Emerson-Junction. These are the house sales on each side in 2026.
“The same house” holds above-grade size, bathrooms, lot width and parking equal. “The same condo” holds size, bathrooms, bedrooms and parking equal; the age and finish of the building are not held equal. Homes on the dividing street itself are left out. Source: TRREB MLS® sales, January 1, 2026 to November 4, 2026, compiled by the Michael Ouzas Real Estate Team.
Thinking of Buying in Bloor West?
Tell us what you’re looking for and Michael will send you homes that fit, with the recent sales behind the prices.
Thinking of Selling in Bloor West?
Four questions and you get an instant estimate range from the latest TRREB stats in your district. If you want the real number, Michael will send a free street-level valuation.
Please answer all four questions.
District-level model, not an appraisal. The number that matters comes from comparables on your block.
Get the Real Number, Free
A full comparative market analysis from the Michael Ouzas team: recent sales on and around your street and a pricing strategy, whether you sell this year or in five.
TRREB District W02, Month by Month
Bloor West Village is in the TRREB community of Runnymede-Bloor West Village, in district W02, with Lambton Baby Point, Junction Area, High Park North and Dovercourt-Wallace Emerson-Junction. These are the district’s monthly numbers from TRREB Market Watch, January 2024 through October 2026.
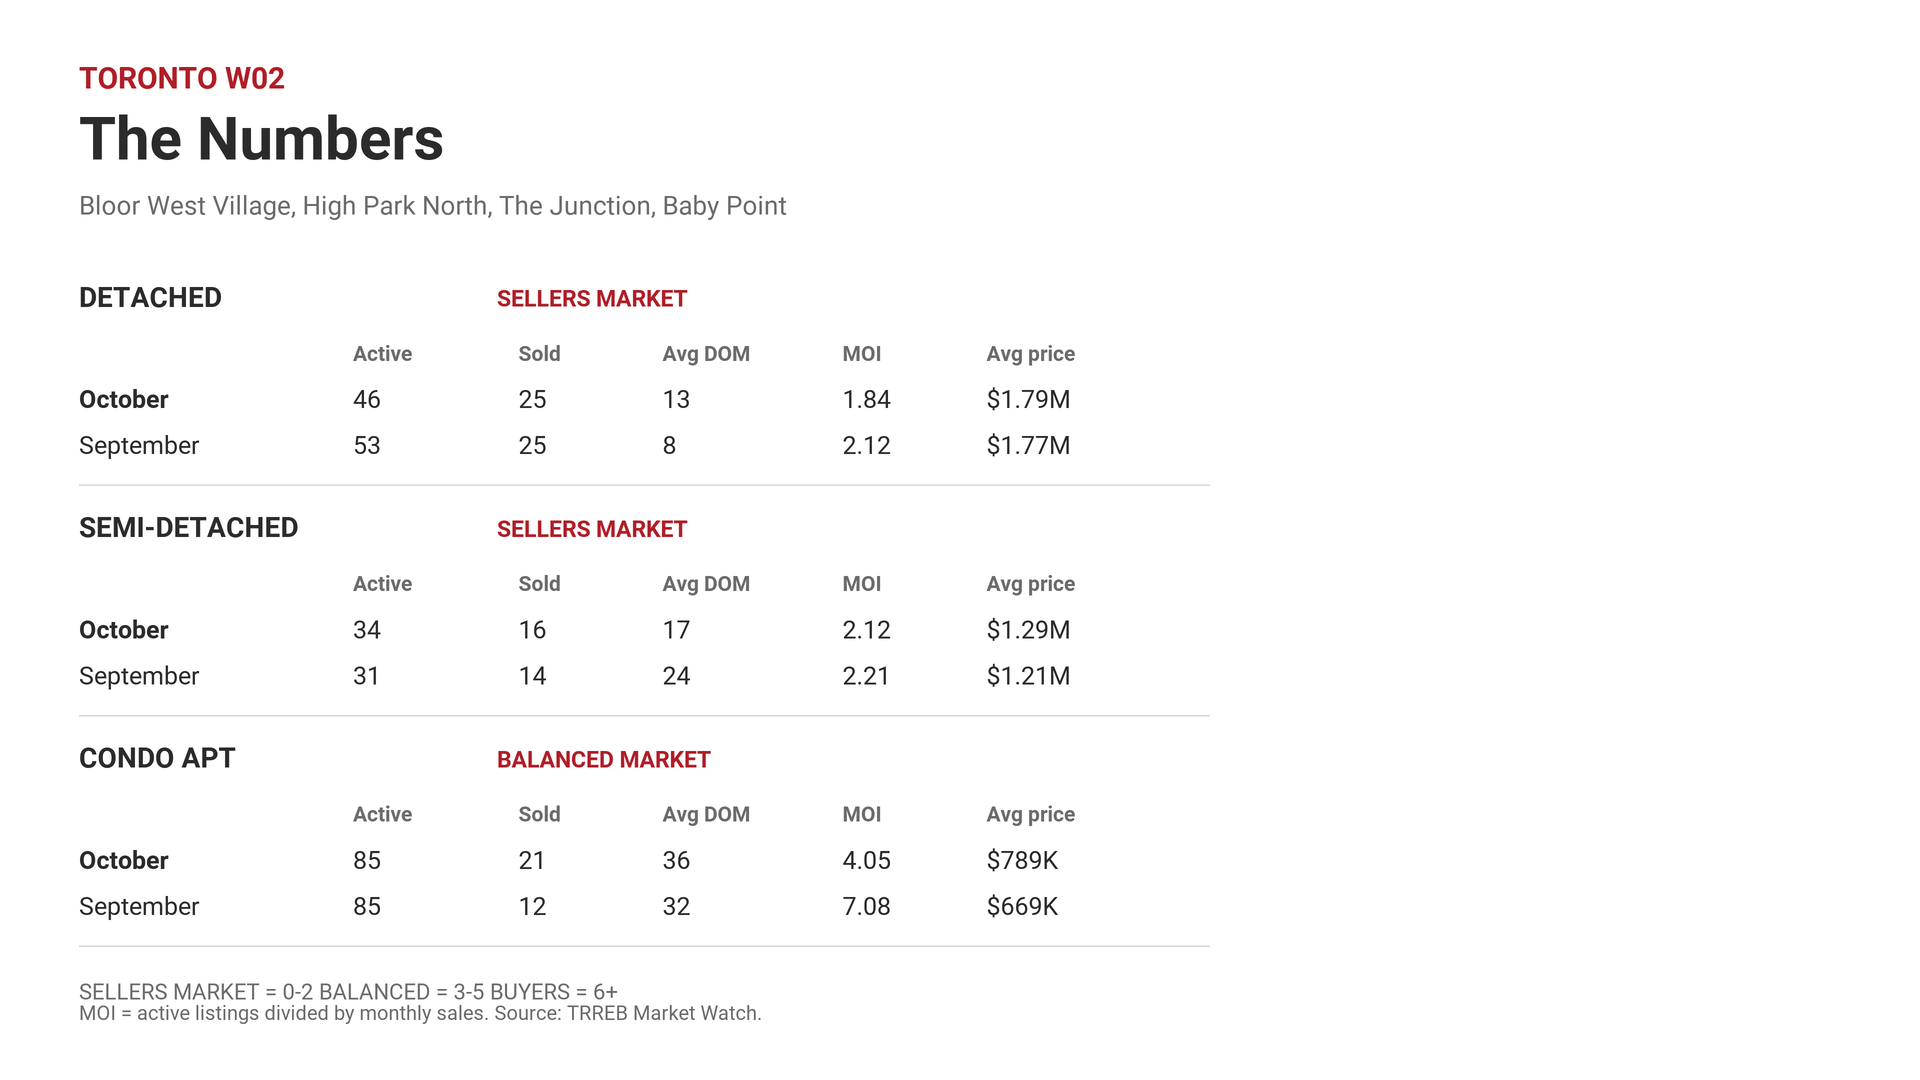
What Each Property Type Costs in W02: October 2026
| Property Type | Average Price | Median | Sales | DOM | Avg YoY |
|---|---|---|---|---|---|
| Detached | $1,785,158 | $1,600,000 | 25 | 13 | +1.6% |
| Semi-Detached | $1,285,281 | $1,304,000 | 16 | 17 | +7.0% |
| Freehold Townhouse | $1,150,750 | $1,216,000 | 4 | 13 | -4.3% |
| Condo Apartment | $789,379 | $736,000 | 21 | 36 | +9.5% |
| Condo Townhouse | $714,080 | $732,500 | 5 | 29 | -25.7% |
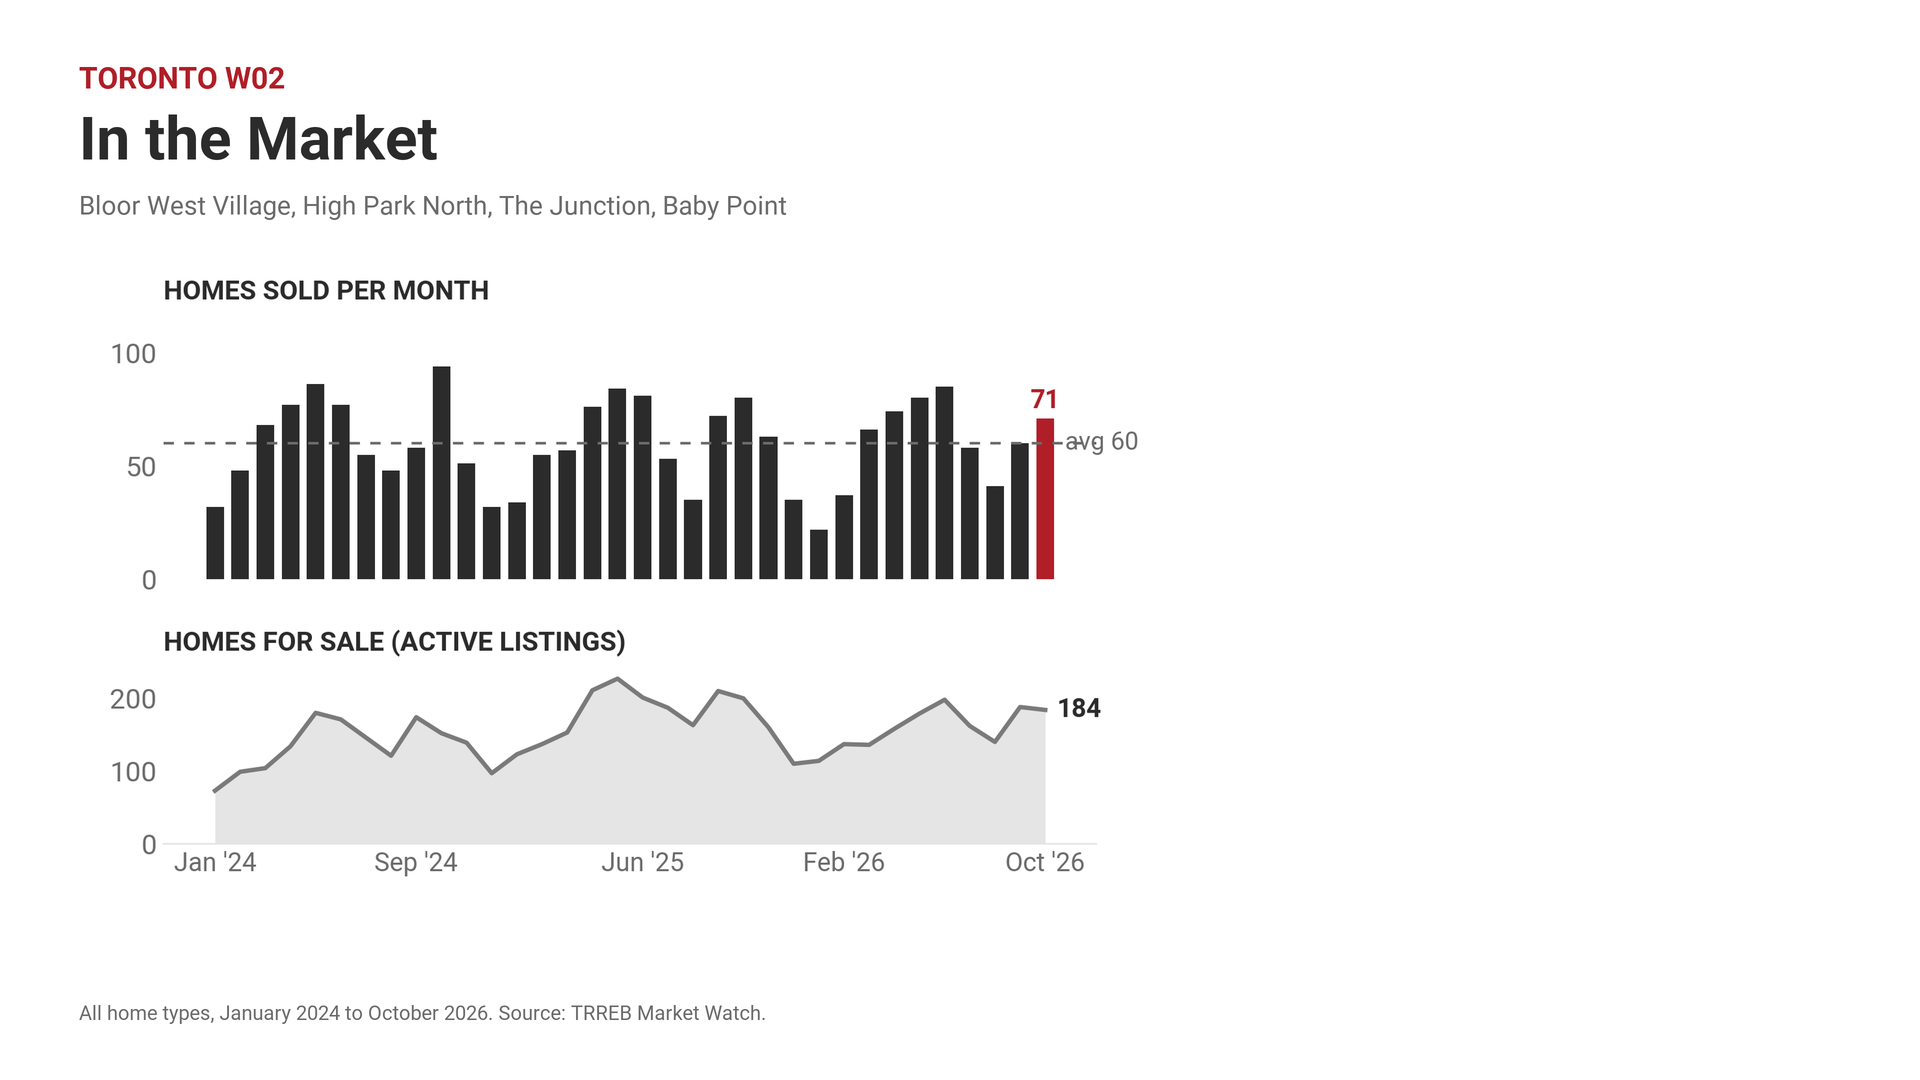
Homes Sold per Month in W02
Seller’s market, 60% and up Balanced, 40 to 59% Buyer’s market, under 40%. Bar colour: that month’s sell rate, sales as a share of new listings. In a month with few new listings it can top 100%, because homes listed earlier sell too.
W02: Last 12 Months
| Month | Average Price | Median Price | Sales | DOM | Sale-to-List | Share Sold |
|---|---|---|---|---|---|---|
| October 2026 | $1,266,814 | $1,250,000 | 71 | 22 | 101% | Balanced 46% |
| September 2026 | $1,311,978 | $1,208,000 | 60 | 18 | 103% | Buyer’s 34% |
| August 2026 | $930,945 | $880,000 | 41 | 34 | 102% | Balanced 58% |
| July 2026 | $1,113,301 | $1,040,000 | 58 | 20 | 100% | Seller’s 64% |
| June 2026 | $1,205,530 | $1,060,000 | 85 | 22 | 102% | Balanced 45% |
| May 2026 | $1,279,049 | $1,191,279 | 80 | 20 | 105% | Balanced 47% |
| April 2026 | $1,348,192 | $1,327,500 | 74 | 14 | 108% | Balanced 46% |
| March 2026 | $1,253,833 | $1,210,000 | 66 | 15 | 106% | Balanced 57% |
| February 2026 | $1,143,483 | $995,500 | 37 | 19 | 107% | Buyer’s 34% |
| January 2026 | $1,092,768 | $964,500 | 22 | 29 | 101% | Buyer’s 26% |
| December 2025 | $929,219 | $845,000 | 35 | 29 | 101% | Seller’s 100% |
| November 2025 | $1,138,506 | $1,040,000 | 63 | 25 | 101% | Seller’s 71% |
October 2026 in Slides
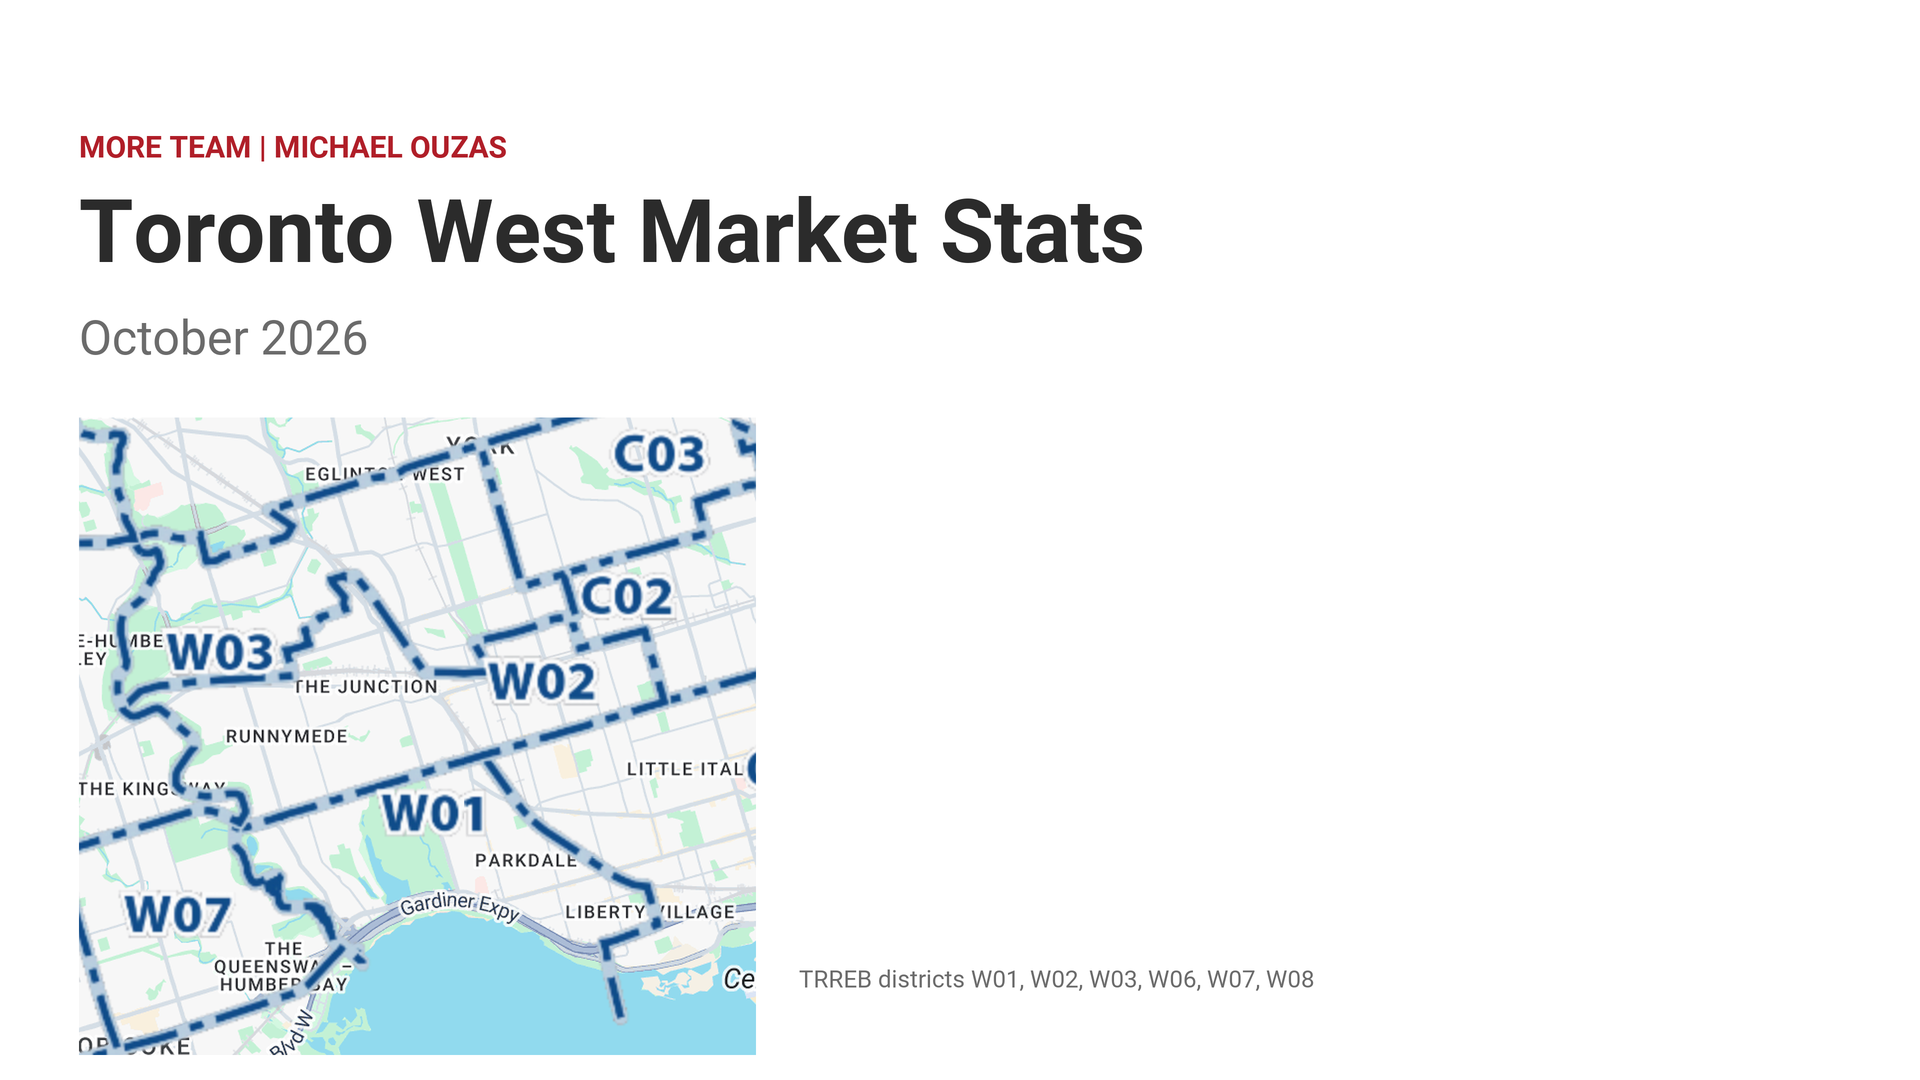
The slide deck from this month’s Bloor West Village and W02 market update. Scroll through the deck, or watch the full breakdown.
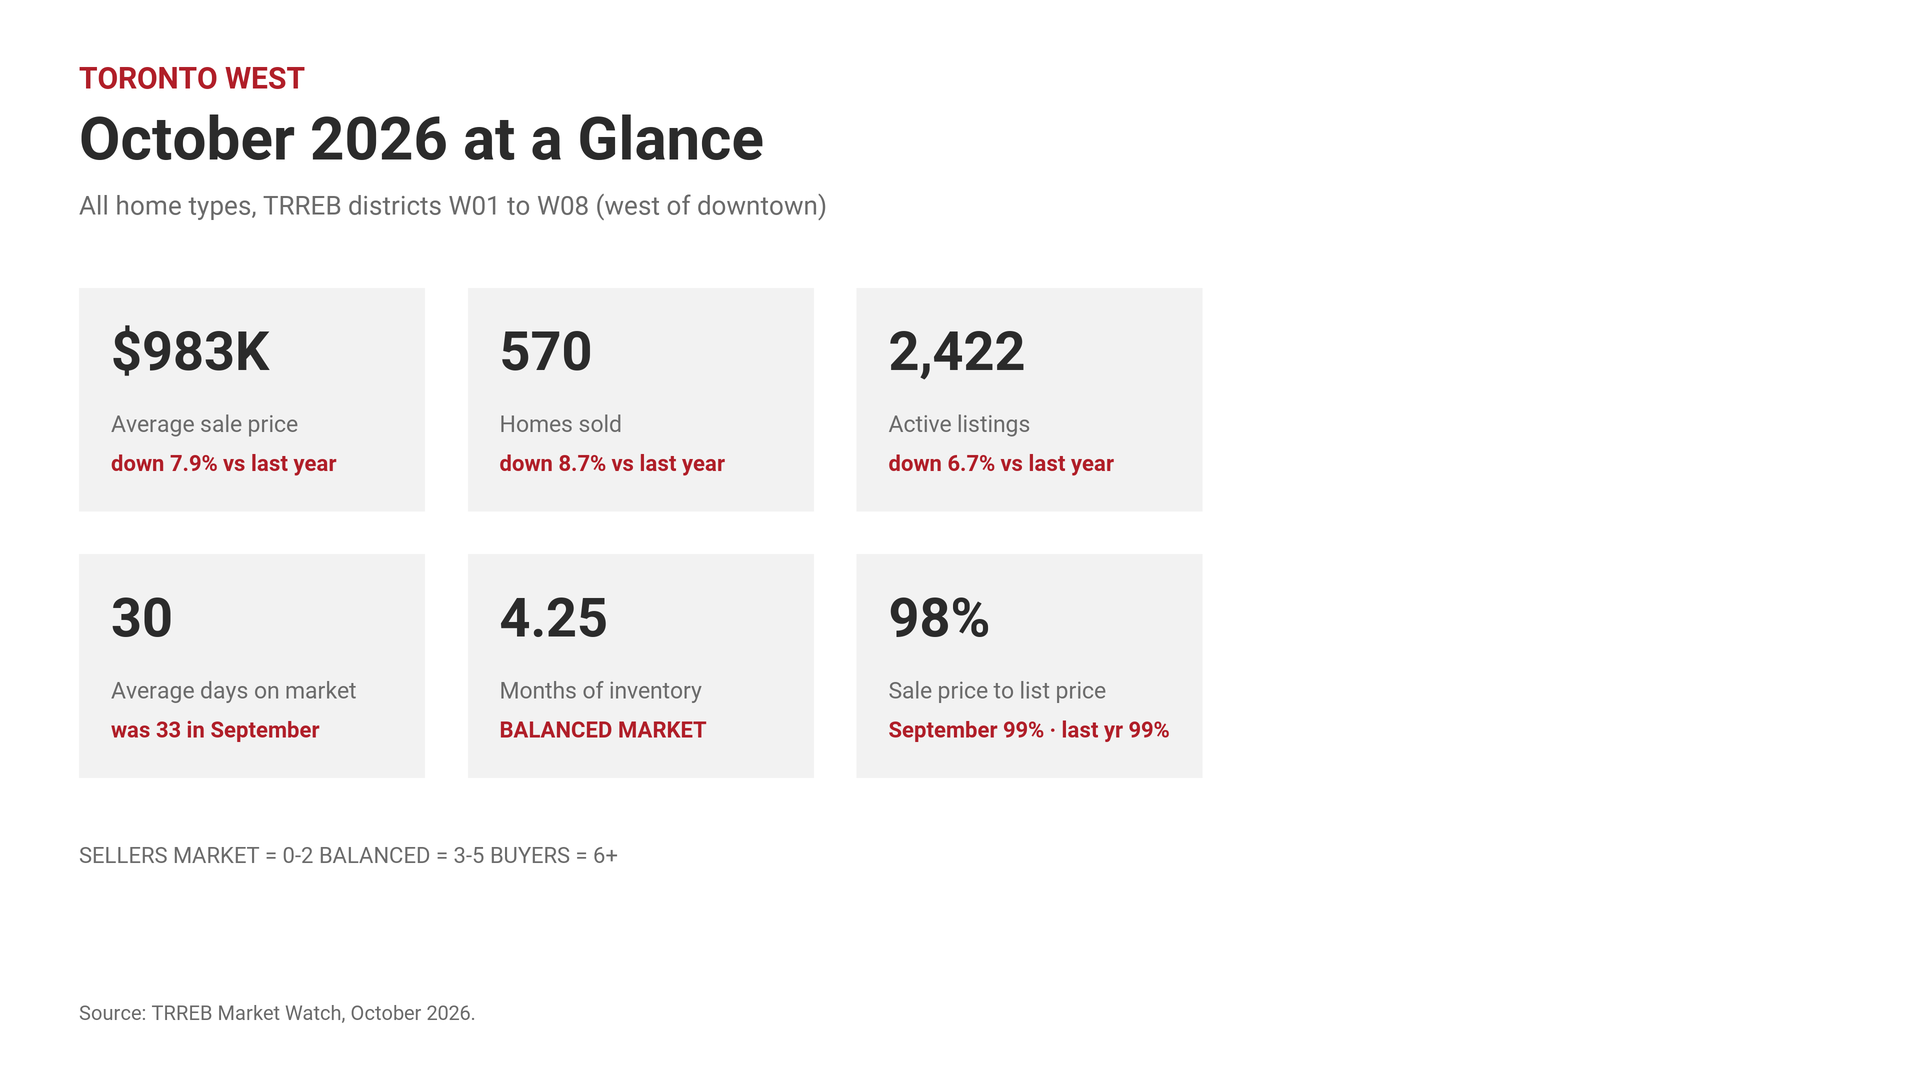
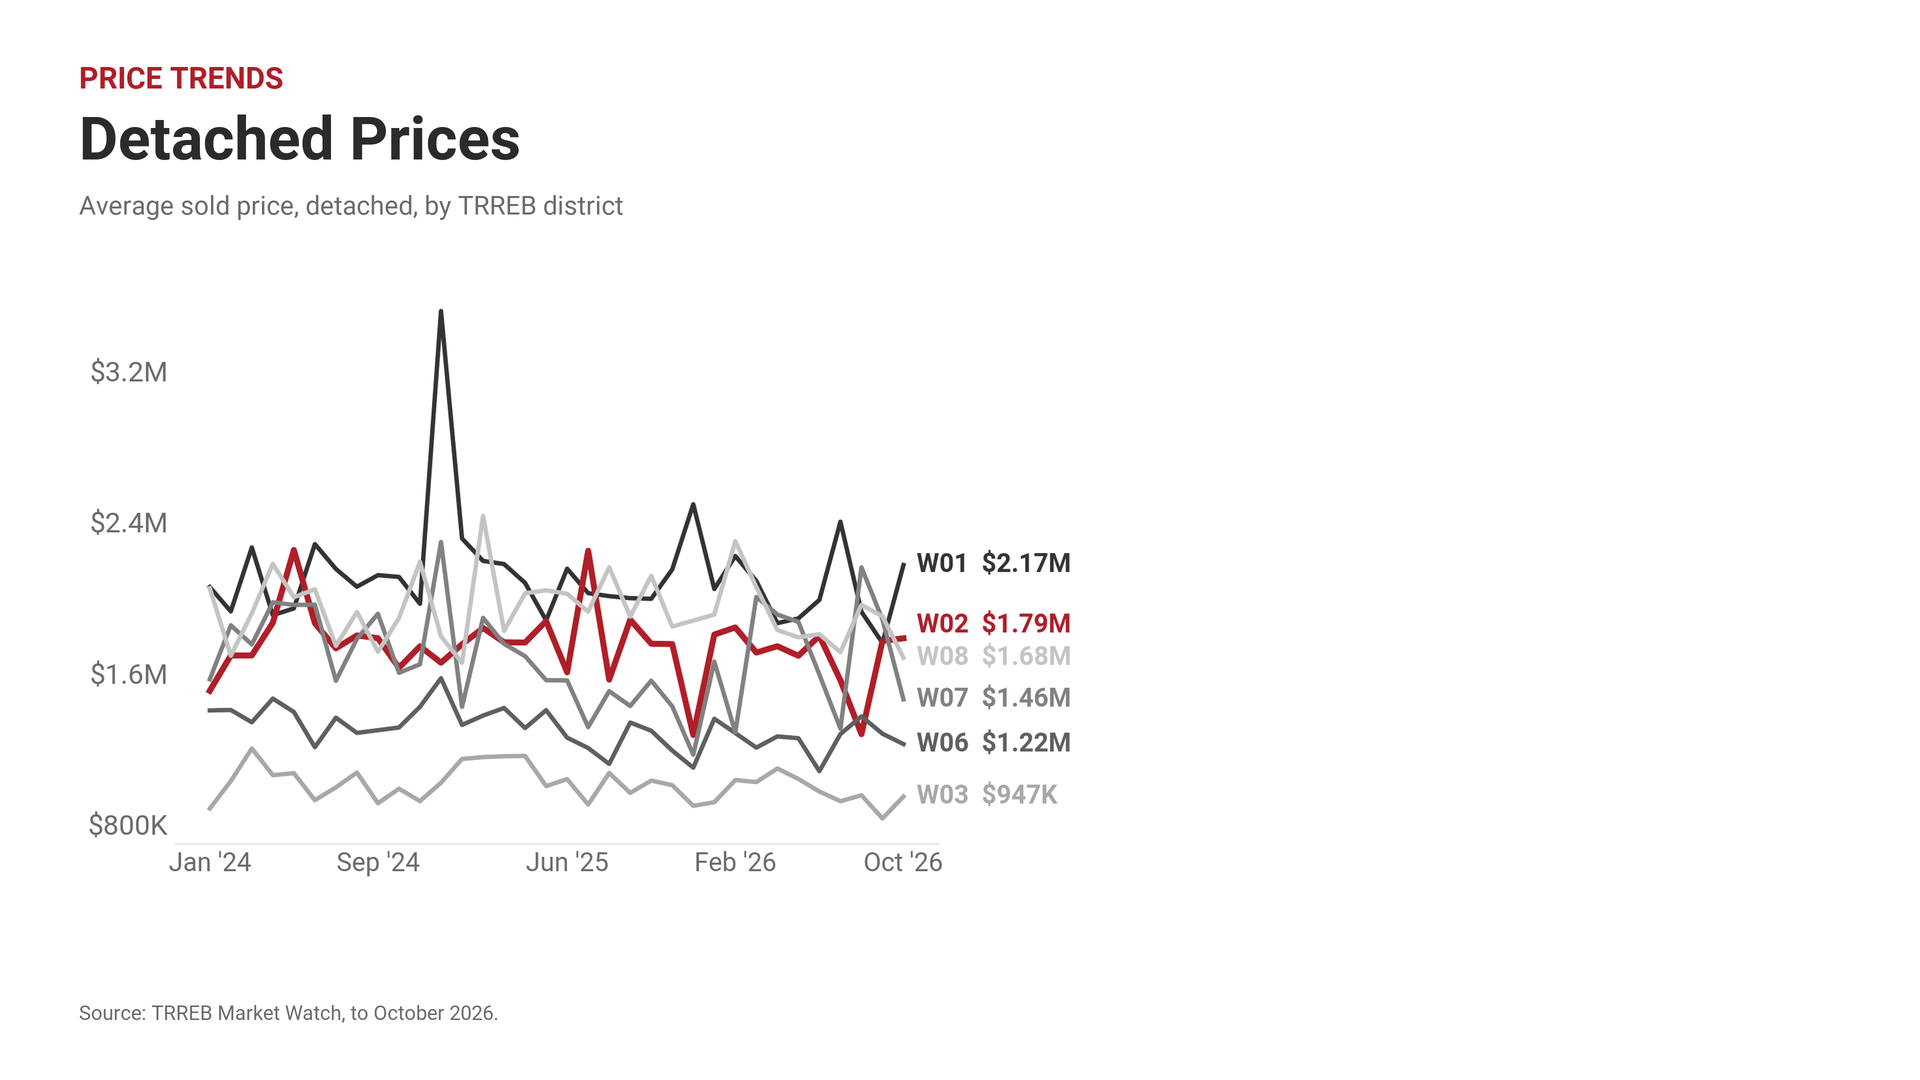
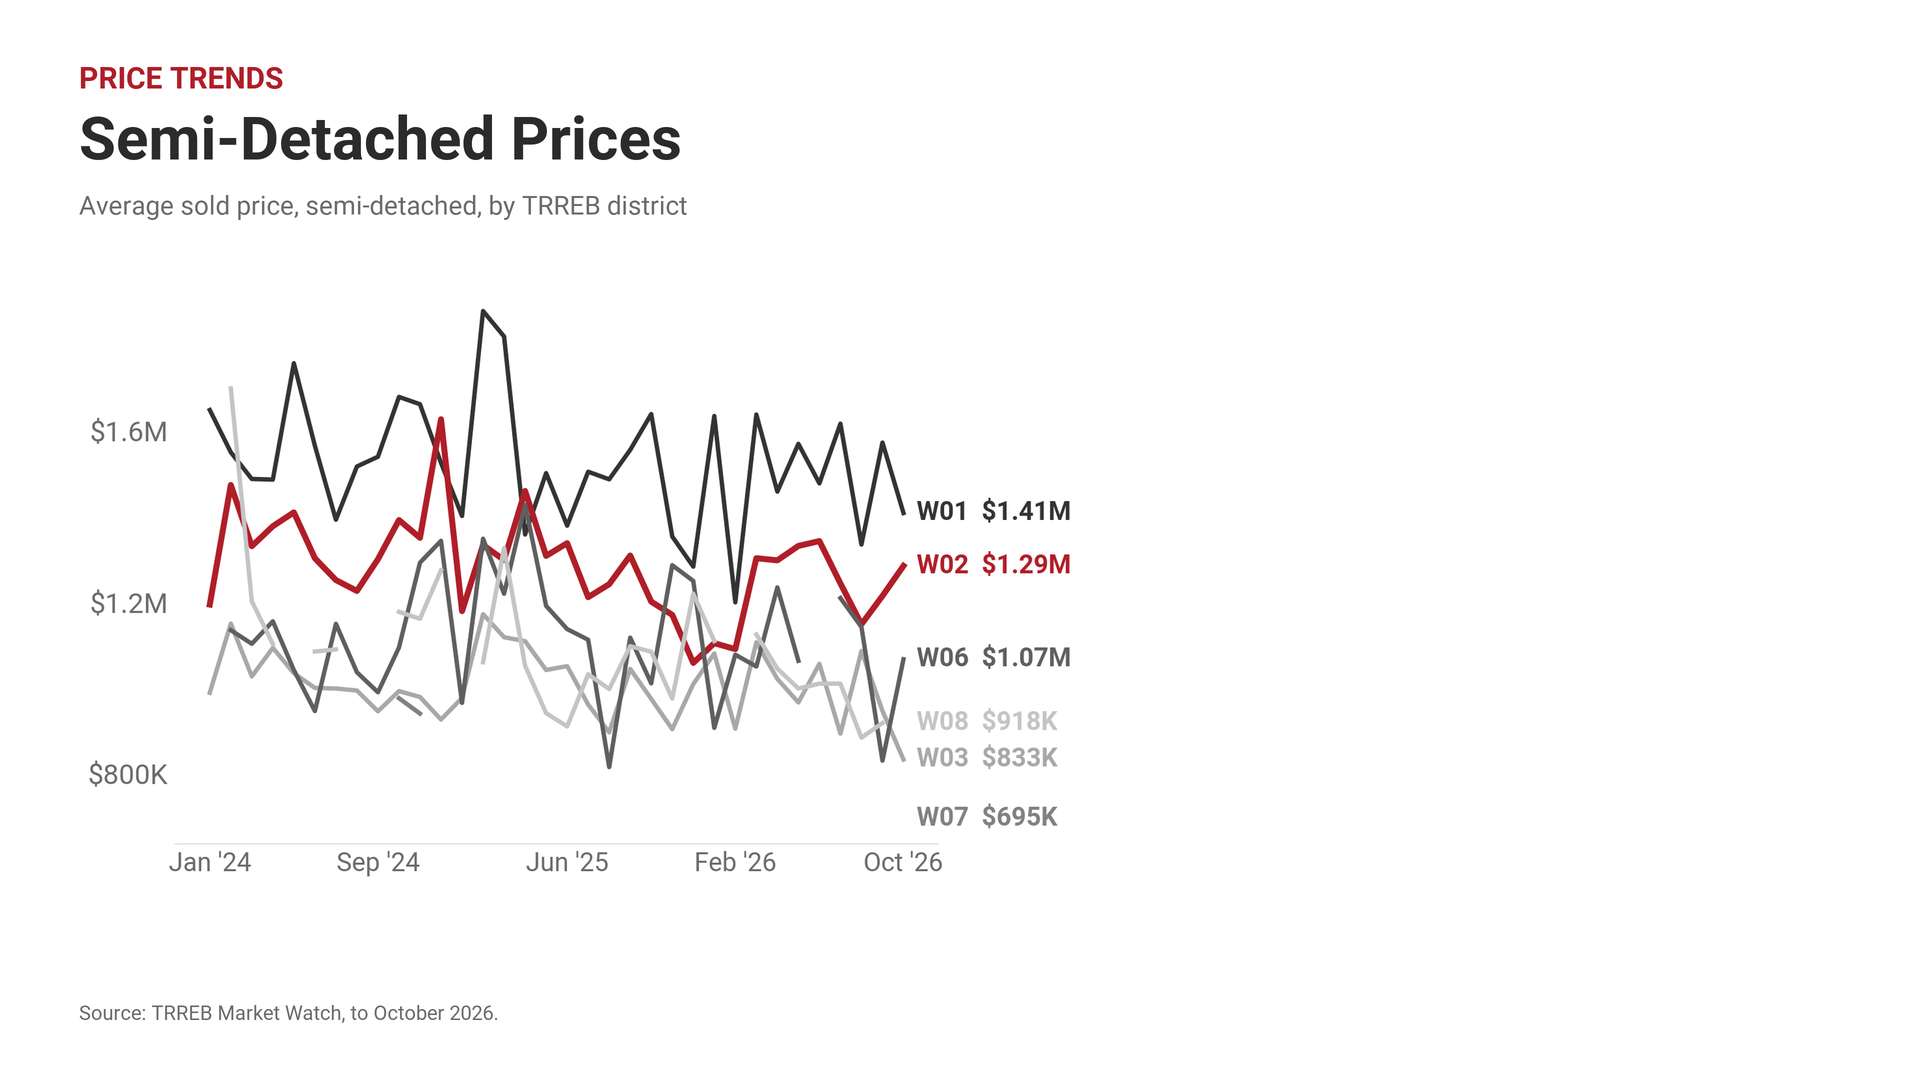
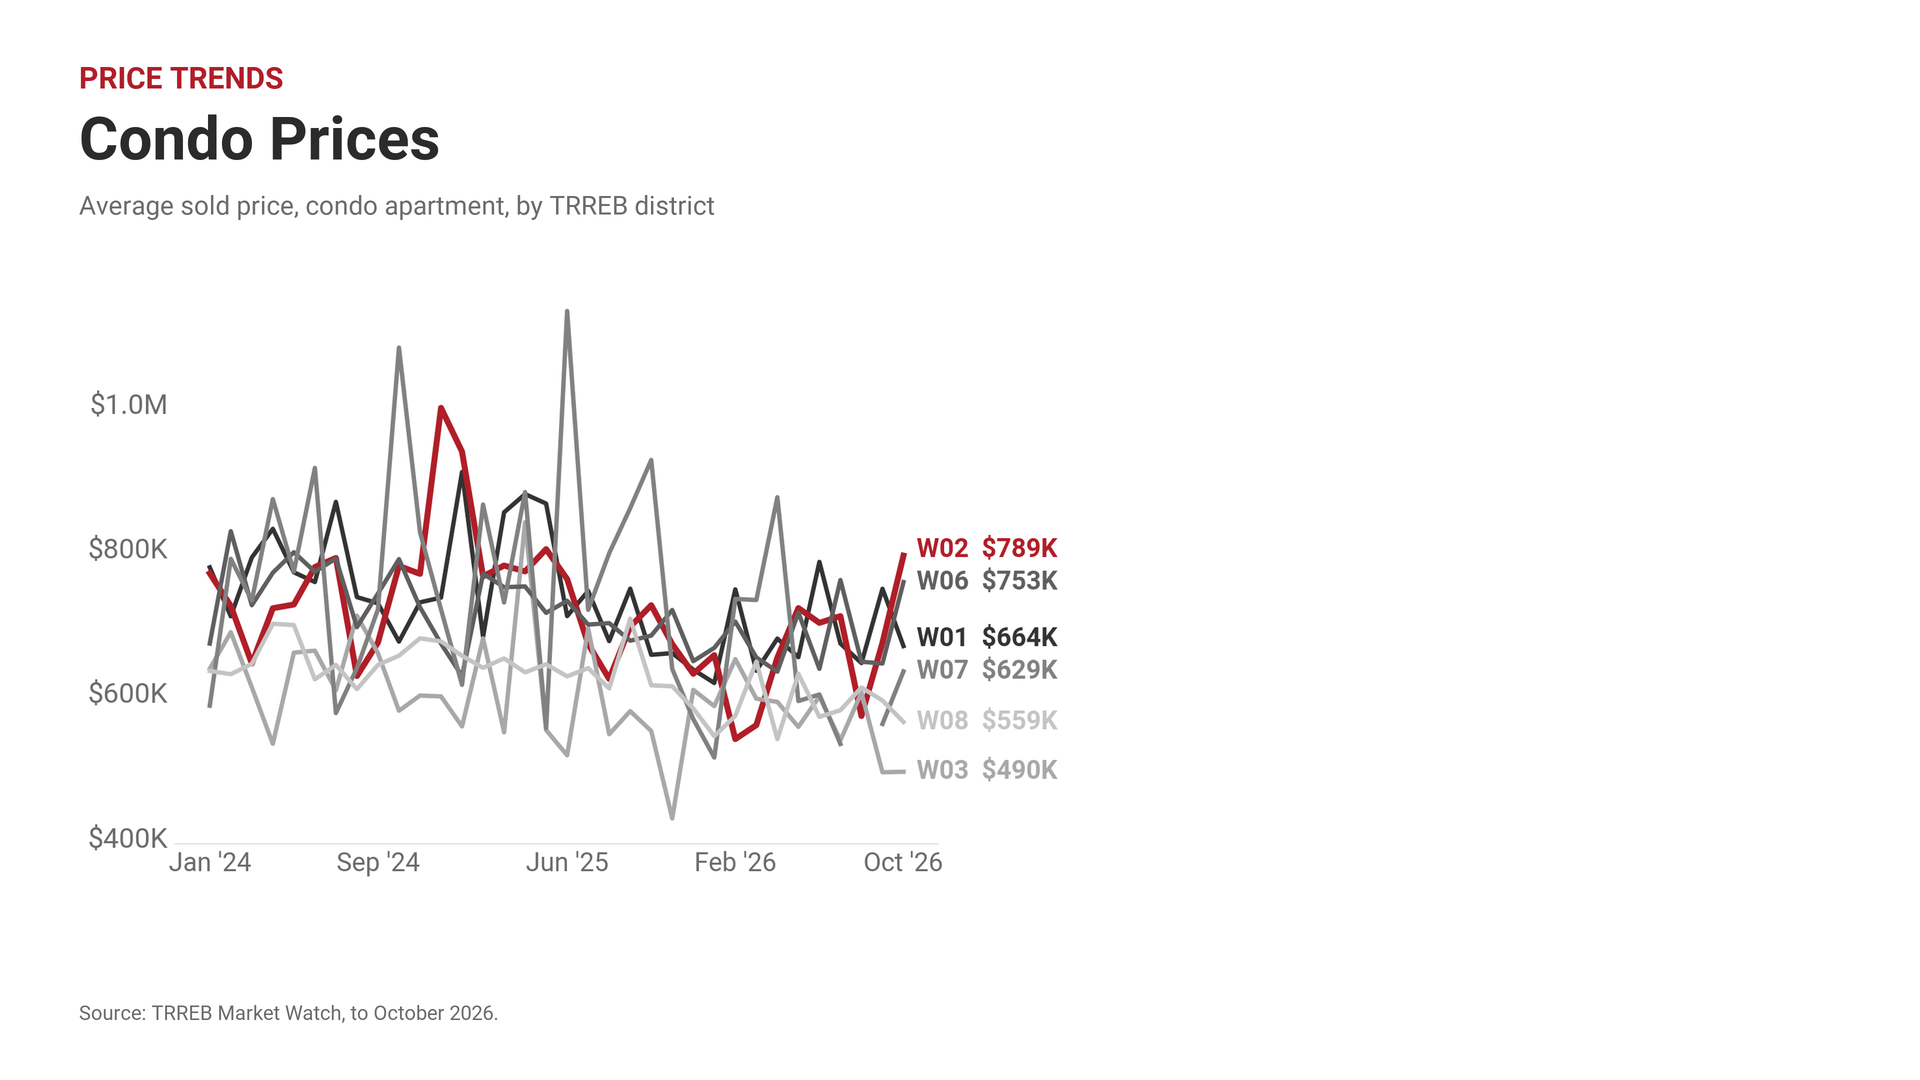
Source: TRREB Market Watch and MLS HPI public tables, October 2026. TRREB districts, not individual neighbourhoods.
What It Means
The W02 average was $1,266,814 in October 2026 (-2.4% year over year) with homes selling in 22 days at 101% of asking, among the strongest sale-to-list ratios in the city. Inventory here stays tight because more people want in than out. If you own in W02 and want to know what your specific street is doing, get an instant estimate or book a call with Michael.
Compare W02 with the rest of the west end: Toronto West market stats.
Neighbourhood guides: Bloor West Village, Runnymede, Baby Point, The Junction, High Park North, Bloor West Village vs The Junction.
More market stats: Roncesvalles, High Park, The Junction, Stonegate-Queensway, Swansea, Little Italy, Liberty Village, King West, Queen West, Bloor West Village, Toronto West. Every Toronto neighbourhood on one map: sell rates and prices by neighbourhood.
Buying in the West End? Buying in Toronto West: what homes cost by pocket and what $1.3M buys.
Selling in the West End? Selling in Toronto West: how fast homes sell, what each pocket sells for and what adds value.
Bloor West Village Market FAQ, 2026
What is the median home price in Bloor West Village in 2026?
From January 1 to November 4, 2026: In Runnymede-Bloor West Village, the median detached house sold for $1,601,000 (57 sales) and the median semi-detached house sold for $1,240,000 (31 sales).
Do homes in Bloor West Village sell over asking?
From January 1 to November 4, 2026: In Runnymede-Bloor West Village, 65% of detached houses and 65% of semi-detached houses sold over the asking price.
What is the price per square foot in Bloor West Village?
From January 1 to November 4, 2026: In Runnymede-Bloor West Village, the median was $1,065 for detached houses and $1,046 for semi-detached houses. Price per square foot uses the above-grade size on the listing. The basement is not included.
Is there a price difference north and south of Annette Street?
Yes. Between Jane Street and Runnymede Road, the same house sells for about 21% less north of Annette than south of it (likely range 12% to 29%), based on 64 house sales from January 1 to November 4, 2026. Median detached: $1,764,500 south (30 sales), $1,285,000 north (10 sales). Median semi-detached: $1,491,500 south (10 sales), $1,202,500 north (11 sales).
Free Toronto tools from the Michael Ouzas Real Estate Team
Statistics on this page are drawn from Toronto Regional Real Estate Board (TRREB) Market Watch reports (January 2024 through October 2026) and are deemed reliable but not guaranteed. Figures are district-level MLS® averages and medians; individual streets and property types vary. This page is for informational purposes only and is not intended to solicit properties currently listed for sale or buyers under contract. Updated monthly when TRREB releases new data. Last updated with October 2026 data. Michael Ouzas Real Estate Team · Royal LePage Signature Realty, Brokerage.